South African vs Immigrants from Western Europe Disability Age Under 5
COMPARE
South African
Immigrants from Western Europe
Disability Age Under 5
Disability Age Under 5 Comparison
South Africans
Immigrants from Western Europe
1.1%
DISABILITY AGE UNDER 5
98.7/ 100
METRIC RATING
68th/ 347
METRIC RANK
1.4%
DISABILITY AGE UNDER 5
0.5/ 100
METRIC RATING
256th/ 347
METRIC RANK
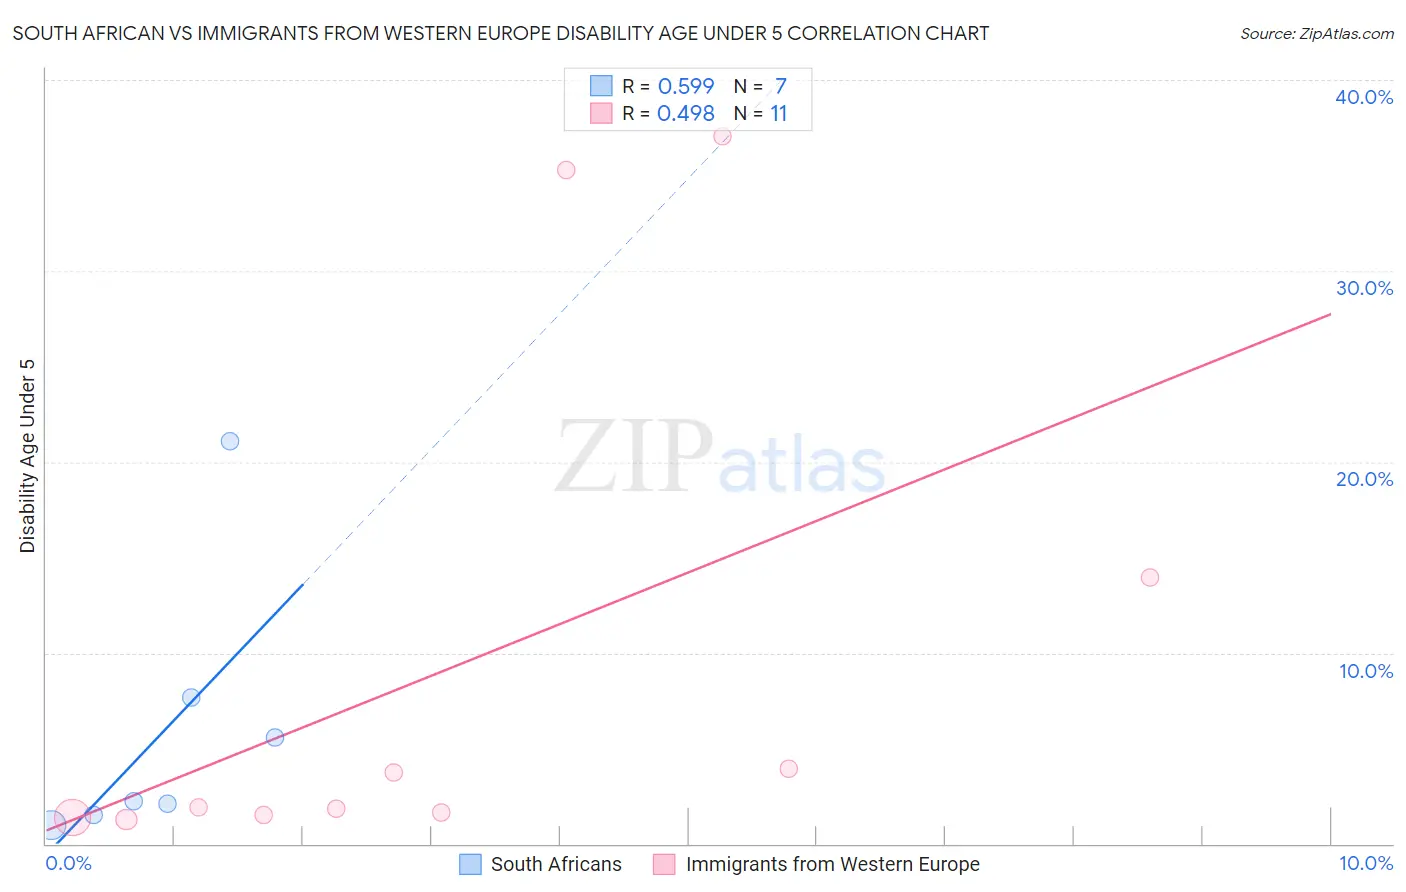
South African vs Immigrants from Western Europe Disability Age Under 5 Correlation Chart
The statistical analysis conducted on geographies consisting of 120,529,150 people shows a substantial positive correlation between the proportion of South Africans and percentage of population with a disability under the age of 5 in the United States with a correlation coefficient (R) of 0.599 and weighted average of 1.1%. Similarly, the statistical analysis conducted on geographies consisting of 244,253,357 people shows a moderate positive correlation between the proportion of Immigrants from Western Europe and percentage of population with a disability under the age of 5 in the United States with a correlation coefficient (R) of 0.498 and weighted average of 1.4%, a difference of 24.0%.
Disability Age Under 5 Correlation Summary
| Measurement | South African | Immigrants from Western Europe |
| Minimum | 0.96% | 1.3% |
| Maximum | 21.1% | 37.0% |
| Range | 20.1% | 35.8% |
| Mean | 5.9% | 9.4% |
| Median | 2.3% | 1.9% |
| Interquartile 25% (IQ1) | 1.5% | 1.5% |
| Interquartile 75% (IQ3) | 7.7% | 14.0% |
| Interquartile Range (IQR) | 6.1% | 12.4% |
| Standard Deviation (Sample) | 7.1% | 13.7% |
| Standard Deviation (Population) | 6.6% | 13.1% |
Similar Demographics by Disability Age Under 5
Demographics Similar to South Africans by Disability Age Under 5
In terms of disability age under 5, the demographic groups most similar to South Africans are Israeli (1.1%, a difference of 0.030%), Immigrants from Belize (1.1%, a difference of 0.040%), Immigrants from Indonesia (1.1%, a difference of 0.10%), Immigrants from Ecuador (1.1%, a difference of 0.11%), and Trinidadian and Tobagonian (1.1%, a difference of 0.17%).
| Demographics | Rating | Rank | Disability Age Under 5 |
| Immigrants | Ethiopia | 99.2 /100 | #61 | Exceptional 1.1% |
| Immigrants | Switzerland | 99.2 /100 | #62 | Exceptional 1.1% |
| Immigrants | Vietnam | 99.1 /100 | #63 | Exceptional 1.1% |
| Egyptians | 98.9 /100 | #64 | Exceptional 1.1% |
| Immigrants | Korea | 98.8 /100 | #65 | Exceptional 1.1% |
| Immigrants | Indonesia | 98.7 /100 | #66 | Exceptional 1.1% |
| Immigrants | Belize | 98.7 /100 | #67 | Exceptional 1.1% |
| South Africans | 98.7 /100 | #68 | Exceptional 1.1% |
| Israelis | 98.7 /100 | #69 | Exceptional 1.1% |
| Immigrants | Ecuador | 98.6 /100 | #70 | Exceptional 1.1% |
| Trinidadians and Tobagonians | 98.6 /100 | #71 | Exceptional 1.1% |
| Burmese | 98.5 /100 | #72 | Exceptional 1.1% |
| Immigrants | Sri Lanka | 98.5 /100 | #73 | Exceptional 1.1% |
| Jordanians | 98.5 /100 | #74 | Exceptional 1.1% |
| Immigrants | Pakistan | 98.4 /100 | #75 | Exceptional 1.1% |
Demographics Similar to Immigrants from Western Europe by Disability Age Under 5
In terms of disability age under 5, the demographic groups most similar to Immigrants from Western Europe are Immigrants from Liberia (1.4%, a difference of 0.42%), Immigrants from Brazil (1.4%, a difference of 0.48%), Australian (1.4%, a difference of 0.56%), Slovene (1.4%, a difference of 0.89%), and Costa Rican (1.4%, a difference of 1.1%).
| Demographics | Rating | Rank | Disability Age Under 5 |
| Bermudans | 1.0 /100 | #249 | Tragic 1.4% |
| Africans | 1.0 /100 | #250 | Tragic 1.4% |
| Immigrants | Hungary | 1.0 /100 | #251 | Tragic 1.4% |
| Immigrants | Scotland | 0.9 /100 | #252 | Tragic 1.4% |
| Australians | 0.7 /100 | #253 | Tragic 1.4% |
| Immigrants | Brazil | 0.7 /100 | #254 | Tragic 1.4% |
| Immigrants | Liberia | 0.6 /100 | #255 | Tragic 1.4% |
| Immigrants | Western Europe | 0.5 /100 | #256 | Tragic 1.4% |
| Slovenes | 0.3 /100 | #257 | Tragic 1.4% |
| Costa Ricans | 0.3 /100 | #258 | Tragic 1.4% |
| Immigrants | Southern Europe | 0.3 /100 | #259 | Tragic 1.4% |
| Slavs | 0.3 /100 | #260 | Tragic 1.4% |
| Immigrants | Netherlands | 0.2 /100 | #261 | Tragic 1.4% |
| Immigrants | Dominica | 0.2 /100 | #262 | Tragic 1.4% |
| Spanish | 0.2 /100 | #263 | Tragic 1.4% |