South African vs Ghanaian 11th Grade
COMPARE
South African
Ghanaian
11th Grade
11th Grade Comparison
South Africans
Ghanaians
93.6%
11TH GRADE
99.2/ 100
METRIC RATING
91st/ 347
METRIC RANK
91.5%
11TH GRADE
0.9/ 100
METRIC RATING
250th/ 347
METRIC RANK
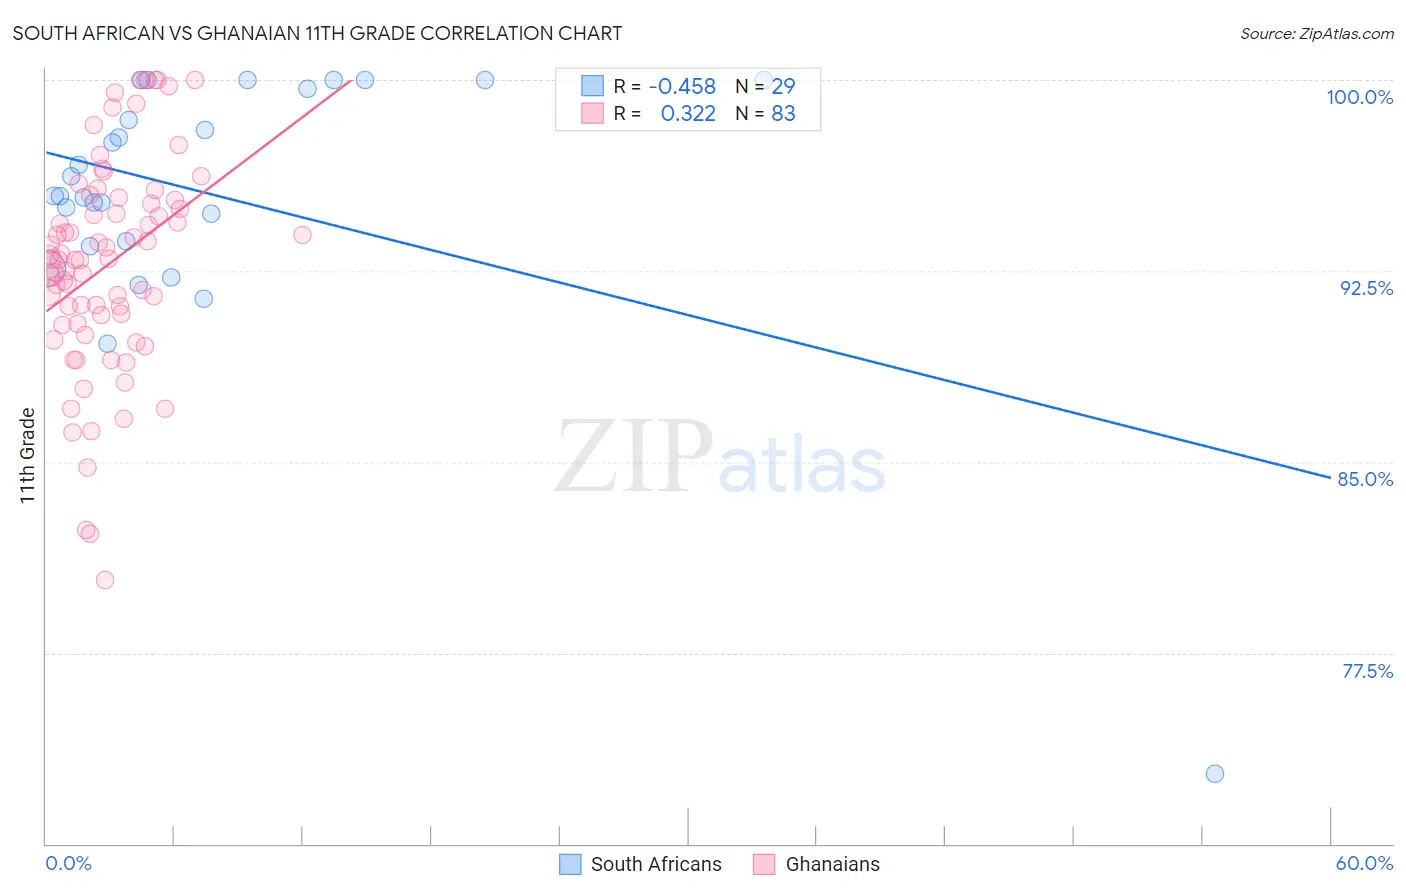
South African vs Ghanaian 11th Grade Correlation Chart
The statistical analysis conducted on geographies consisting of 182,604,532 people shows a moderate negative correlation between the proportion of South Africans and percentage of population with at least 11th grade education in the United States with a correlation coefficient (R) of -0.458 and weighted average of 93.6%. Similarly, the statistical analysis conducted on geographies consisting of 190,714,079 people shows a mild positive correlation between the proportion of Ghanaians and percentage of population with at least 11th grade education in the United States with a correlation coefficient (R) of 0.322 and weighted average of 91.5%, a difference of 2.3%.
11th Grade Correlation Summary
| Measurement | South African | Ghanaian |
| Minimum | 72.7% | 80.3% |
| Maximum | 100.0% | 100.0% |
| Range | 27.3% | 19.7% |
| Mean | 95.5% | 92.7% |
| Median | 95.4% | 93.0% |
| Interquartile 25% (IQ1) | 93.6% | 90.4% |
| Interquartile 75% (IQ3) | 99.8% | 95.3% |
| Interquartile Range (IQR) | 6.3% | 4.9% |
| Standard Deviation (Sample) | 5.3% | 4.2% |
| Standard Deviation (Population) | 5.2% | 4.2% |
Similar Demographics by 11th Grade
Demographics Similar to South Africans by 11th Grade
In terms of 11th grade, the demographic groups most similar to South Africans are Ottawa (93.6%, a difference of 0.010%), Immigrants from Bulgaria (93.6%, a difference of 0.010%), Immigrants from South Central Asia (93.6%, a difference of 0.020%), Immigrants from Western Europe (93.6%, a difference of 0.020%), and Cambodian (93.6%, a difference of 0.020%).
| Demographics | Rating | Rank | 11th Grade |
| Immigrants | Taiwan | 99.3 /100 | #84 | Exceptional 93.6% |
| Immigrants | Switzerland | 99.3 /100 | #85 | Exceptional 93.6% |
| Immigrants | South Central Asia | 99.2 /100 | #86 | Exceptional 93.6% |
| Immigrants | Western Europe | 99.2 /100 | #87 | Exceptional 93.6% |
| Cambodians | 99.2 /100 | #88 | Exceptional 93.6% |
| Burmese | 99.2 /100 | #89 | Exceptional 93.6% |
| Ottawa | 99.2 /100 | #90 | Exceptional 93.6% |
| South Africans | 99.2 /100 | #91 | Exceptional 93.6% |
| Immigrants | Bulgaria | 99.1 /100 | #92 | Exceptional 93.6% |
| Puget Sound Salish | 99.1 /100 | #93 | Exceptional 93.6% |
| Swiss | 99.0 /100 | #94 | Exceptional 93.6% |
| Immigrants | France | 99.0 /100 | #95 | Exceptional 93.6% |
| Immigrants | Turkey | 98.9 /100 | #96 | Exceptional 93.5% |
| Immigrants | Iran | 98.9 /100 | #97 | Exceptional 93.5% |
| Immigrants | Israel | 98.8 /100 | #98 | Exceptional 93.5% |
Demographics Similar to Ghanaians by 11th Grade
In terms of 11th grade, the demographic groups most similar to Ghanaians are Peruvian (91.5%, a difference of 0.0%), Immigrants from Philippines (91.5%, a difference of 0.010%), Immigrants from Uzbekistan (91.5%, a difference of 0.010%), Immigrants from Costa Rica (91.4%, a difference of 0.020%), and Immigrants from Nigeria (91.4%, a difference of 0.030%).
| Demographics | Rating | Rank | 11th Grade |
| Immigrants | Thailand | 1.4 /100 | #243 | Tragic 91.6% |
| Senegalese | 1.4 /100 | #244 | Tragic 91.6% |
| Africans | 1.3 /100 | #245 | Tragic 91.5% |
| Seminole | 1.2 /100 | #246 | Tragic 91.5% |
| Immigrants | Philippines | 1.0 /100 | #247 | Tragic 91.5% |
| Immigrants | Uzbekistan | 1.0 /100 | #248 | Tragic 91.5% |
| Peruvians | 1.0 /100 | #249 | Tragic 91.5% |
| Ghanaians | 0.9 /100 | #250 | Tragic 91.5% |
| Immigrants | Costa Rica | 0.9 /100 | #251 | Tragic 91.4% |
| Immigrants | Nigeria | 0.8 /100 | #252 | Tragic 91.4% |
| Immigrants | South America | 0.8 /100 | #253 | Tragic 91.4% |
| Immigrants | Eritrea | 0.7 /100 | #254 | Tragic 91.4% |
| Blacks/African Americans | 0.7 /100 | #255 | Tragic 91.4% |
| Immigrants | Senegal | 0.7 /100 | #256 | Tragic 91.4% |
| Cajuns | 0.7 /100 | #257 | Tragic 91.4% |