Somali vs Welsh Hearing Disability
COMPARE
Somali
Welsh
Hearing Disability
Hearing Disability Comparison
Somalis
Welsh
2.8%
HEARING DISABILITY
96.7/ 100
METRIC RATING
87th/ 347
METRIC RANK
3.7%
HEARING DISABILITY
0.0/ 100
METRIC RATING
295th/ 347
METRIC RANK
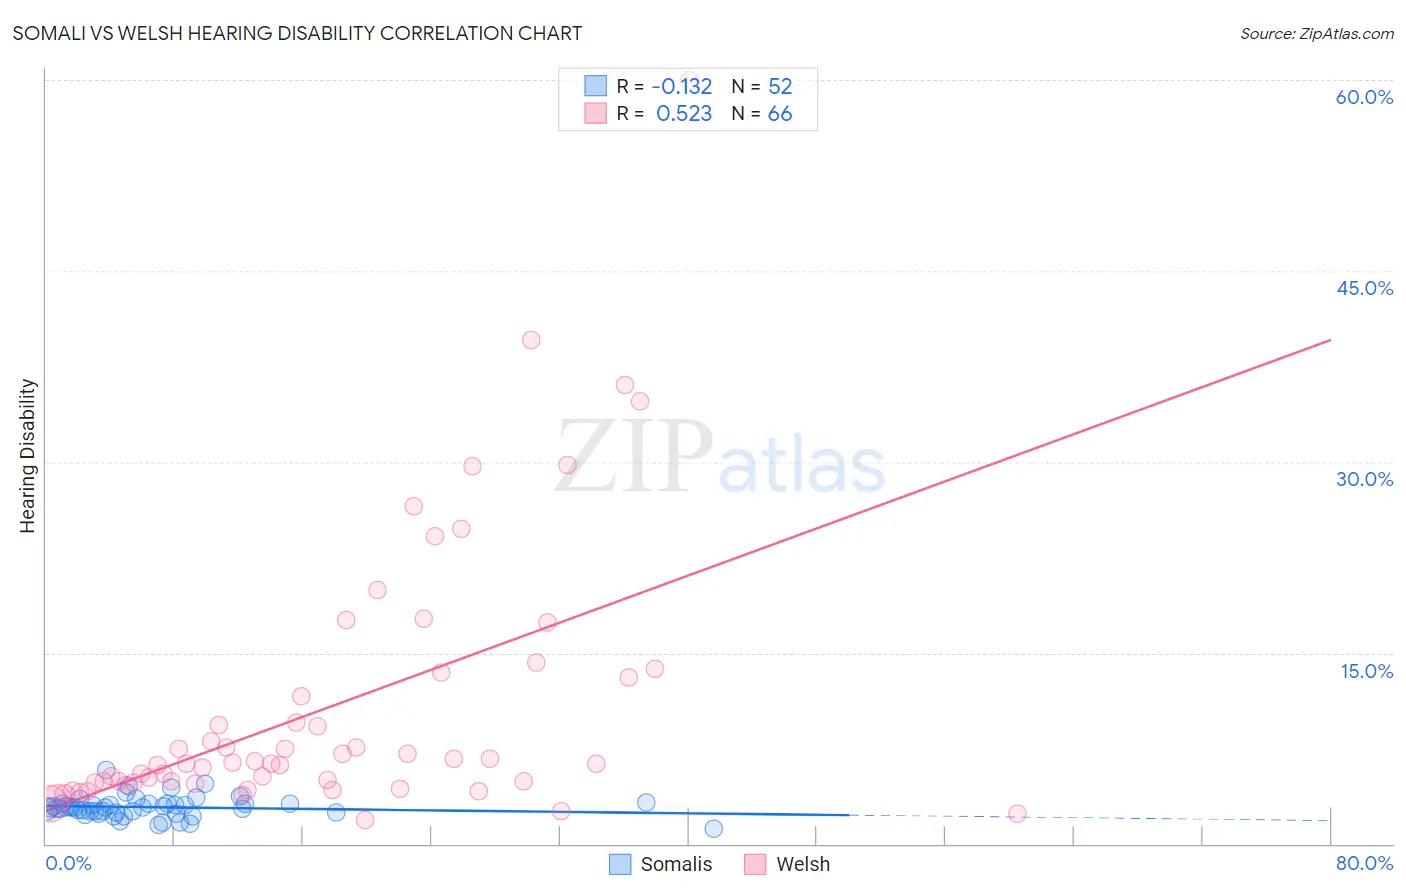
Somali vs Welsh Hearing Disability Correlation Chart
The statistical analysis conducted on geographies consisting of 99,308,769 people shows a poor negative correlation between the proportion of Somalis and percentage of population with hearing disability in the United States with a correlation coefficient (R) of -0.132 and weighted average of 2.8%. Similarly, the statistical analysis conducted on geographies consisting of 528,244,925 people shows a substantial positive correlation between the proportion of Welsh and percentage of population with hearing disability in the United States with a correlation coefficient (R) of 0.523 and weighted average of 3.7%, a difference of 34.5%.
Hearing Disability Correlation Summary
| Measurement | Somali | Welsh |
| Minimum | 1.1% | 1.9% |
| Maximum | 5.8% | 60.0% |
| Range | 4.7% | 58.1% |
| Mean | 2.9% | 10.7% |
| Median | 2.9% | 6.3% |
| Interquartile 25% (IQ1) | 2.4% | 4.8% |
| Interquartile 75% (IQ3) | 3.1% | 13.0% |
| Interquartile Range (IQR) | 0.68% | 8.2% |
| Standard Deviation (Sample) | 0.83% | 10.8% |
| Standard Deviation (Population) | 0.83% | 10.7% |
Similar Demographics by Hearing Disability
Demographics Similar to Somalis by Hearing Disability
In terms of hearing disability, the demographic groups most similar to Somalis are Immigrants from Turkey (2.8%, a difference of 0.040%), Belizean (2.8%, a difference of 0.070%), Immigrants from Morocco (2.8%, a difference of 0.090%), Immigrants from Iran (2.8%, a difference of 0.11%), and Immigrants from Northern Africa (2.8%, a difference of 0.13%).
| Demographics | Rating | Rank | Hearing Disability |
| Immigrants | Asia | 97.2 /100 | #80 | Exceptional 2.7% |
| Immigrants | Uruguay | 97.2 /100 | #81 | Exceptional 2.7% |
| Immigrants | Armenia | 97.2 /100 | #82 | Exceptional 2.7% |
| Immigrants | Cuba | 97.2 /100 | #83 | Exceptional 2.7% |
| Immigrants | Argentina | 97.0 /100 | #84 | Exceptional 2.8% |
| Immigrants | Northern Africa | 96.9 /100 | #85 | Exceptional 2.8% |
| Immigrants | Iran | 96.8 /100 | #86 | Exceptional 2.8% |
| Somalis | 96.7 /100 | #87 | Exceptional 2.8% |
| Immigrants | Turkey | 96.7 /100 | #88 | Exceptional 2.8% |
| Belizeans | 96.6 /100 | #89 | Exceptional 2.8% |
| Immigrants | Morocco | 96.6 /100 | #90 | Exceptional 2.8% |
| Immigrants | Middle Africa | 96.5 /100 | #91 | Exceptional 2.8% |
| Iranians | 96.4 /100 | #92 | Exceptional 2.8% |
| Immigrants | Kuwait | 96.3 /100 | #93 | Exceptional 2.8% |
| Uruguayans | 95.9 /100 | #94 | Exceptional 2.8% |
Demographics Similar to Welsh by Hearing Disability
In terms of hearing disability, the demographic groups most similar to Welsh are Pima (3.7%, a difference of 0.13%), Immigrants from the Azores (3.7%, a difference of 0.20%), Iroquois (3.7%, a difference of 0.27%), Celtic (3.7%, a difference of 0.39%), and Norwegian (3.7%, a difference of 0.51%).
| Demographics | Rating | Rank | Hearing Disability |
| Irish | 0.0 /100 | #288 | Tragic 3.7% |
| Chinese | 0.0 /100 | #289 | Tragic 3.7% |
| Whites/Caucasians | 0.0 /100 | #290 | Tragic 3.7% |
| Finns | 0.0 /100 | #291 | Tragic 3.7% |
| Native Hawaiians | 0.0 /100 | #292 | Tragic 3.7% |
| Norwegians | 0.0 /100 | #293 | Tragic 3.7% |
| Iroquois | 0.0 /100 | #294 | Tragic 3.7% |
| Welsh | 0.0 /100 | #295 | Tragic 3.7% |
| Pima | 0.0 /100 | #296 | Tragic 3.7% |
| Immigrants | Azores | 0.0 /100 | #297 | Tragic 3.7% |
| Celtics | 0.0 /100 | #298 | Tragic 3.7% |
| Germans | 0.0 /100 | #299 | Tragic 3.7% |
| Scottish | 0.0 /100 | #300 | Tragic 3.7% |
| Pennsylvania Germans | 0.0 /100 | #301 | Tragic 3.7% |
| Dutch | 0.0 /100 | #302 | Tragic 3.7% |