Somali vs Immigrants from Africa Hearing Disability
COMPARE
Somali
Immigrants from Africa
Hearing Disability
Hearing Disability Comparison
Somalis
Immigrants from Africa
2.8%
HEARING DISABILITY
96.7/ 100
METRIC RATING
87th/ 347
METRIC RANK
2.7%
HEARING DISABILITY
98.0/ 100
METRIC RATING
68th/ 347
METRIC RANK
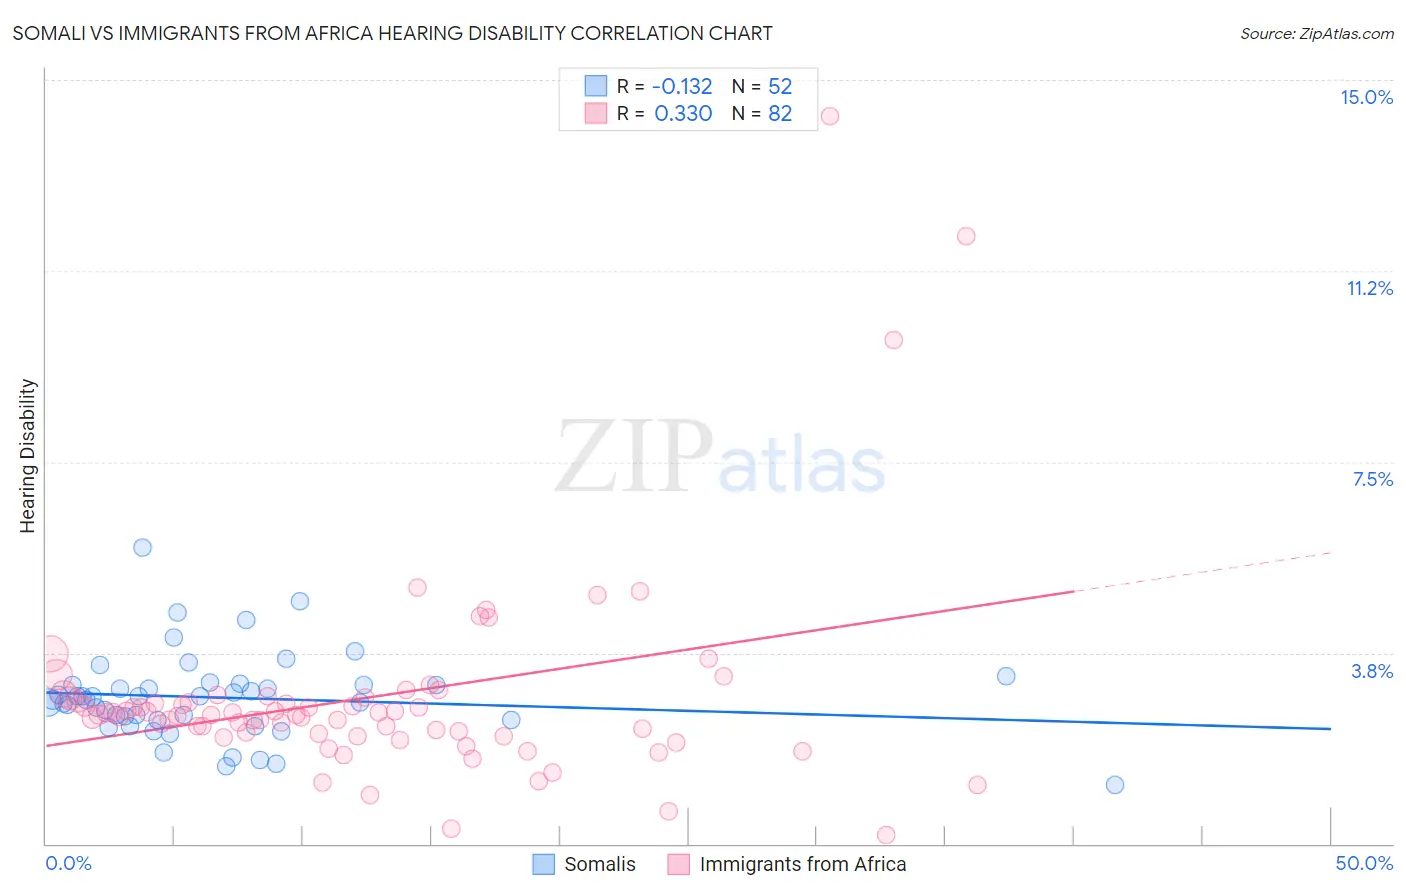
Somali vs Immigrants from Africa Hearing Disability Correlation Chart
The statistical analysis conducted on geographies consisting of 99,308,769 people shows a poor negative correlation between the proportion of Somalis and percentage of population with hearing disability in the United States with a correlation coefficient (R) of -0.132 and weighted average of 2.8%. Similarly, the statistical analysis conducted on geographies consisting of 469,129,407 people shows a mild positive correlation between the proportion of Immigrants from Africa and percentage of population with hearing disability in the United States with a correlation coefficient (R) of 0.330 and weighted average of 2.7%, a difference of 1.3%.
Hearing Disability Correlation Summary
| Measurement | Somali | Immigrants from Africa |
| Minimum | 1.1% | 0.17% |
| Maximum | 5.8% | 14.3% |
| Range | 4.7% | 14.1% |
| Mean | 2.9% | 2.9% |
| Median | 2.9% | 2.5% |
| Interquartile 25% (IQ1) | 2.4% | 2.2% |
| Interquartile 75% (IQ3) | 3.1% | 2.9% |
| Interquartile Range (IQR) | 0.68% | 0.70% |
| Standard Deviation (Sample) | 0.83% | 2.0% |
| Standard Deviation (Population) | 0.83% | 2.0% |
Demographics Similar to Somalis and Immigrants from Africa by Hearing Disability
In terms of hearing disability, the demographic groups most similar to Somalis are Immigrants from Iran (2.8%, a difference of 0.11%), Immigrants from Northern Africa (2.8%, a difference of 0.13%), Immigrants from Argentina (2.8%, a difference of 0.21%), Immigrants from Cuba (2.7%, a difference of 0.40%), and Immigrants from Armenia (2.7%, a difference of 0.41%). Similarly, the demographic groups most similar to Immigrants from Africa are Nicaraguan (2.7%, a difference of 0.040%), Egyptian (2.7%, a difference of 0.13%), Peruvian (2.7%, a difference of 0.27%), Central American (2.7%, a difference of 0.32%), and Afghan (2.7%, a difference of 0.42%).
| Demographics | Rating | Rank | Hearing Disability |
| Egyptians | 98.1 /100 | #67 | Exceptional 2.7% |
| Immigrants | Africa | 98.0 /100 | #68 | Exceptional 2.7% |
| Nicaraguans | 97.9 /100 | #69 | Exceptional 2.7% |
| Peruvians | 97.7 /100 | #70 | Exceptional 2.7% |
| Central Americans | 97.7 /100 | #71 | Exceptional 2.7% |
| Afghans | 97.6 /100 | #72 | Exceptional 2.7% |
| Argentineans | 97.5 /100 | #73 | Exceptional 2.7% |
| Immigrants | Korea | 97.5 /100 | #74 | Exceptional 2.7% |
| Immigrants | Saudi Arabia | 97.5 /100 | #75 | Exceptional 2.7% |
| Asians | 97.5 /100 | #76 | Exceptional 2.7% |
| Immigrants | Malaysia | 97.5 /100 | #77 | Exceptional 2.7% |
| Mongolians | 97.4 /100 | #78 | Exceptional 2.7% |
| Colombians | 97.4 /100 | #79 | Exceptional 2.7% |
| Immigrants | Asia | 97.2 /100 | #80 | Exceptional 2.7% |
| Immigrants | Uruguay | 97.2 /100 | #81 | Exceptional 2.7% |
| Immigrants | Armenia | 97.2 /100 | #82 | Exceptional 2.7% |
| Immigrants | Cuba | 97.2 /100 | #83 | Exceptional 2.7% |
| Immigrants | Argentina | 97.0 /100 | #84 | Exceptional 2.8% |
| Immigrants | Northern Africa | 96.9 /100 | #85 | Exceptional 2.8% |
| Immigrants | Iran | 96.8 /100 | #86 | Exceptional 2.8% |
| Somalis | 96.7 /100 | #87 | Exceptional 2.8% |