Yaqui vs Welsh Hearing Disability
COMPARE
Yaqui
Welsh
Hearing Disability
Hearing Disability Comparison
Yaqui
Welsh
3.4%
HEARING DISABILITY
0.2/ 100
METRIC RATING
257th/ 347
METRIC RANK
3.7%
HEARING DISABILITY
0.0/ 100
METRIC RATING
295th/ 347
METRIC RANK
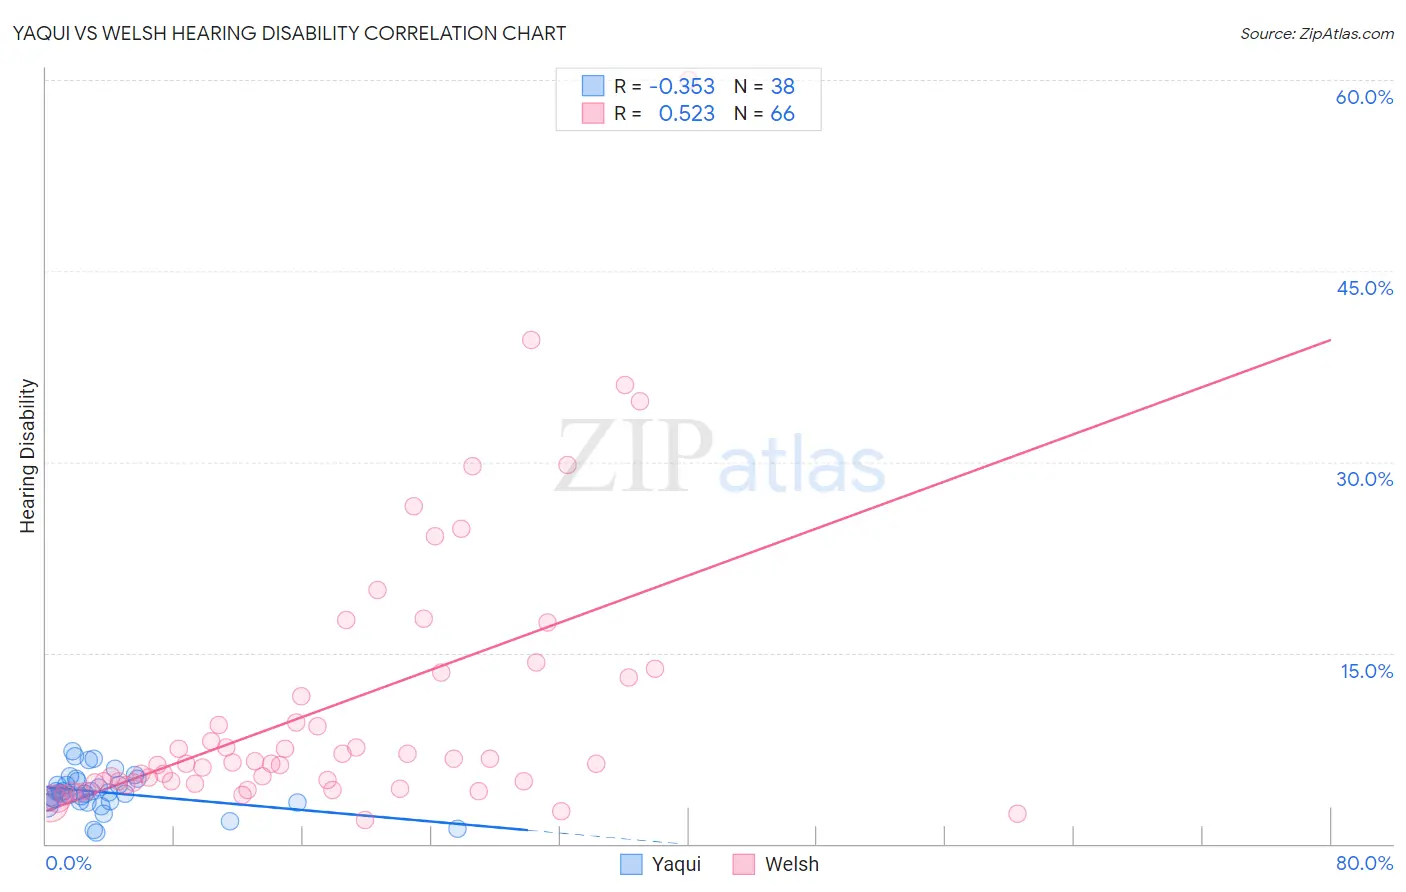
Yaqui vs Welsh Hearing Disability Correlation Chart
The statistical analysis conducted on geographies consisting of 107,718,352 people shows a mild negative correlation between the proportion of Yaqui and percentage of population with hearing disability in the United States with a correlation coefficient (R) of -0.353 and weighted average of 3.4%. Similarly, the statistical analysis conducted on geographies consisting of 528,244,925 people shows a substantial positive correlation between the proportion of Welsh and percentage of population with hearing disability in the United States with a correlation coefficient (R) of 0.523 and weighted average of 3.7%, a difference of 7.6%.
Hearing Disability Correlation Summary
| Measurement | Yaqui | Welsh |
| Minimum | 0.85% | 1.9% |
| Maximum | 7.2% | 60.0% |
| Range | 6.4% | 58.1% |
| Mean | 4.0% | 10.7% |
| Median | 4.0% | 6.3% |
| Interquartile 25% (IQ1) | 3.3% | 4.8% |
| Interquartile 75% (IQ3) | 5.0% | 13.0% |
| Interquartile Range (IQR) | 1.7% | 8.2% |
| Standard Deviation (Sample) | 1.5% | 10.8% |
| Standard Deviation (Population) | 1.5% | 10.7% |
Similar Demographics by Hearing Disability
Demographics Similar to Yaqui by Hearing Disability
In terms of hearing disability, the demographic groups most similar to Yaqui are Northern European (3.4%, a difference of 0.070%), Slovene (3.5%, a difference of 0.30%), Portuguese (3.5%, a difference of 0.38%), Hawaiian (3.5%, a difference of 0.42%), and Hmong (3.4%, a difference of 0.45%).
| Demographics | Rating | Rank | Hearing Disability |
| Yuman | 0.4 /100 | #250 | Tragic 3.4% |
| Hungarians | 0.4 /100 | #251 | Tragic 3.4% |
| Croatians | 0.4 /100 | #252 | Tragic 3.4% |
| Carpatho Rusyns | 0.3 /100 | #253 | Tragic 3.4% |
| Slavs | 0.2 /100 | #254 | Tragic 3.4% |
| Poles | 0.2 /100 | #255 | Tragic 3.4% |
| Hmong | 0.2 /100 | #256 | Tragic 3.4% |
| Yaqui | 0.2 /100 | #257 | Tragic 3.4% |
| Northern Europeans | 0.2 /100 | #258 | Tragic 3.4% |
| Slovenes | 0.1 /100 | #259 | Tragic 3.5% |
| Portuguese | 0.1 /100 | #260 | Tragic 3.5% |
| Hawaiians | 0.1 /100 | #261 | Tragic 3.5% |
| Immigrants | North America | 0.1 /100 | #262 | Tragic 3.5% |
| Immigrants | Canada | 0.1 /100 | #263 | Tragic 3.5% |
| Immigrants | Germany | 0.1 /100 | #264 | Tragic 3.5% |
Demographics Similar to Welsh by Hearing Disability
In terms of hearing disability, the demographic groups most similar to Welsh are Pima (3.7%, a difference of 0.13%), Immigrants from the Azores (3.7%, a difference of 0.20%), Iroquois (3.7%, a difference of 0.27%), Celtic (3.7%, a difference of 0.39%), and Norwegian (3.7%, a difference of 0.51%).
| Demographics | Rating | Rank | Hearing Disability |
| Irish | 0.0 /100 | #288 | Tragic 3.7% |
| Chinese | 0.0 /100 | #289 | Tragic 3.7% |
| Whites/Caucasians | 0.0 /100 | #290 | Tragic 3.7% |
| Finns | 0.0 /100 | #291 | Tragic 3.7% |
| Native Hawaiians | 0.0 /100 | #292 | Tragic 3.7% |
| Norwegians | 0.0 /100 | #293 | Tragic 3.7% |
| Iroquois | 0.0 /100 | #294 | Tragic 3.7% |
| Welsh | 0.0 /100 | #295 | Tragic 3.7% |
| Pima | 0.0 /100 | #296 | Tragic 3.7% |
| Immigrants | Azores | 0.0 /100 | #297 | Tragic 3.7% |
| Celtics | 0.0 /100 | #298 | Tragic 3.7% |
| Germans | 0.0 /100 | #299 | Tragic 3.7% |
| Scottish | 0.0 /100 | #300 | Tragic 3.7% |
| Pennsylvania Germans | 0.0 /100 | #301 | Tragic 3.7% |
| Dutch | 0.0 /100 | #302 | Tragic 3.7% |