Somali vs Yugoslavian Hearing Disability
COMPARE
Somali
Yugoslavian
Hearing Disability
Hearing Disability Comparison
Somalis
Yugoslavians
2.8%
HEARING DISABILITY
96.7/ 100
METRIC RATING
87th/ 347
METRIC RANK
3.3%
HEARING DISABILITY
1.0/ 100
METRIC RATING
242nd/ 347
METRIC RANK
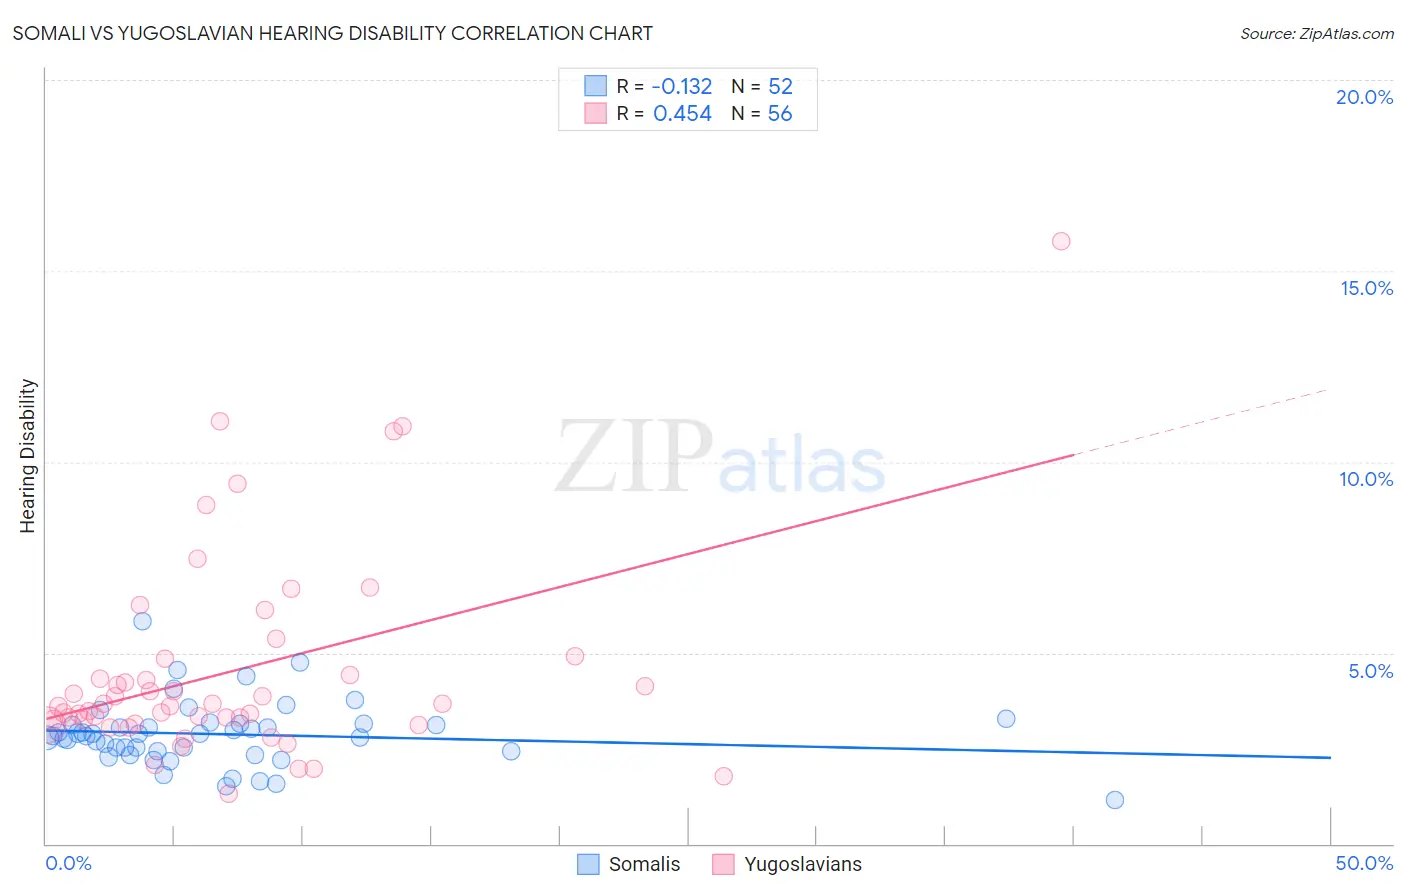
Somali vs Yugoslavian Hearing Disability Correlation Chart
The statistical analysis conducted on geographies consisting of 99,308,769 people shows a poor negative correlation between the proportion of Somalis and percentage of population with hearing disability in the United States with a correlation coefficient (R) of -0.132 and weighted average of 2.8%. Similarly, the statistical analysis conducted on geographies consisting of 285,663,811 people shows a moderate positive correlation between the proportion of Yugoslavians and percentage of population with hearing disability in the United States with a correlation coefficient (R) of 0.454 and weighted average of 3.3%, a difference of 20.3%.
Hearing Disability Correlation Summary
| Measurement | Somali | Yugoslavian |
| Minimum | 1.1% | 1.3% |
| Maximum | 5.8% | 15.8% |
| Range | 4.7% | 14.5% |
| Mean | 2.9% | 4.5% |
| Median | 2.9% | 3.6% |
| Interquartile 25% (IQ1) | 2.4% | 3.2% |
| Interquartile 75% (IQ3) | 3.1% | 4.6% |
| Interquartile Range (IQR) | 0.68% | 1.5% |
| Standard Deviation (Sample) | 0.83% | 2.7% |
| Standard Deviation (Population) | 0.83% | 2.7% |
Similar Demographics by Hearing Disability
Demographics Similar to Somalis by Hearing Disability
In terms of hearing disability, the demographic groups most similar to Somalis are Immigrants from Turkey (2.8%, a difference of 0.040%), Belizean (2.8%, a difference of 0.070%), Immigrants from Morocco (2.8%, a difference of 0.090%), Immigrants from Iran (2.8%, a difference of 0.11%), and Immigrants from Northern Africa (2.8%, a difference of 0.13%).
| Demographics | Rating | Rank | Hearing Disability |
| Immigrants | Asia | 97.2 /100 | #80 | Exceptional 2.7% |
| Immigrants | Uruguay | 97.2 /100 | #81 | Exceptional 2.7% |
| Immigrants | Armenia | 97.2 /100 | #82 | Exceptional 2.7% |
| Immigrants | Cuba | 97.2 /100 | #83 | Exceptional 2.7% |
| Immigrants | Argentina | 97.0 /100 | #84 | Exceptional 2.8% |
| Immigrants | Northern Africa | 96.9 /100 | #85 | Exceptional 2.8% |
| Immigrants | Iran | 96.8 /100 | #86 | Exceptional 2.8% |
| Somalis | 96.7 /100 | #87 | Exceptional 2.8% |
| Immigrants | Turkey | 96.7 /100 | #88 | Exceptional 2.8% |
| Belizeans | 96.6 /100 | #89 | Exceptional 2.8% |
| Immigrants | Morocco | 96.6 /100 | #90 | Exceptional 2.8% |
| Immigrants | Middle Africa | 96.5 /100 | #91 | Exceptional 2.8% |
| Iranians | 96.4 /100 | #92 | Exceptional 2.8% |
| Immigrants | Kuwait | 96.3 /100 | #93 | Exceptional 2.8% |
| Uruguayans | 95.9 /100 | #94 | Exceptional 2.8% |
Demographics Similar to Yugoslavians by Hearing Disability
In terms of hearing disability, the demographic groups most similar to Yugoslavians are Samoan (3.3%, a difference of 0.11%), Immigrants from Western Europe (3.3%, a difference of 0.17%), Immigrants from Netherlands (3.3%, a difference of 0.18%), Assyrian/Chaldean/Syriac (3.3%, a difference of 0.24%), and Nepalese (3.3%, a difference of 0.36%).
| Demographics | Rating | Rank | Hearing Disability |
| Guamanians/Chamorros | 2.2 /100 | #235 | Tragic 3.3% |
| Serbians | 2.2 /100 | #236 | Tragic 3.3% |
| Immigrants | Austria | 1.8 /100 | #237 | Tragic 3.3% |
| German Russians | 1.8 /100 | #238 | Tragic 3.3% |
| Nepalese | 1.2 /100 | #239 | Tragic 3.3% |
| Immigrants | Netherlands | 1.1 /100 | #240 | Tragic 3.3% |
| Samoans | 1.1 /100 | #241 | Tragic 3.3% |
| Yugoslavians | 1.0 /100 | #242 | Tragic 3.3% |
| Immigrants | Western Europe | 1.0 /100 | #243 | Tragic 3.3% |
| Assyrians/Chaldeans/Syriacs | 0.9 /100 | #244 | Tragic 3.3% |
| Immigrants | Scotland | 0.8 /100 | #245 | Tragic 3.3% |
| Immigrants | England | 0.7 /100 | #246 | Tragic 3.3% |
| Lithuanians | 0.6 /100 | #247 | Tragic 3.4% |
| Austrians | 0.6 /100 | #248 | Tragic 3.4% |
| Italians | 0.4 /100 | #249 | Tragic 3.4% |