Somali vs Welsh Child Poverty Under the Age of 16
COMPARE
Somali
Welsh
Child Poverty Under the Age of 16
Child Poverty Under the Age of 16 Comparison
Somalis
Welsh
21.0%
CHILD POVERTY UNDER THE AGE OF 16
0.0/ 100
METRIC RATING
304th/ 347
METRIC RANK
15.3%
CHILD POVERTY UNDER THE AGE OF 16
87.2/ 100
METRIC RATING
138th/ 347
METRIC RANK
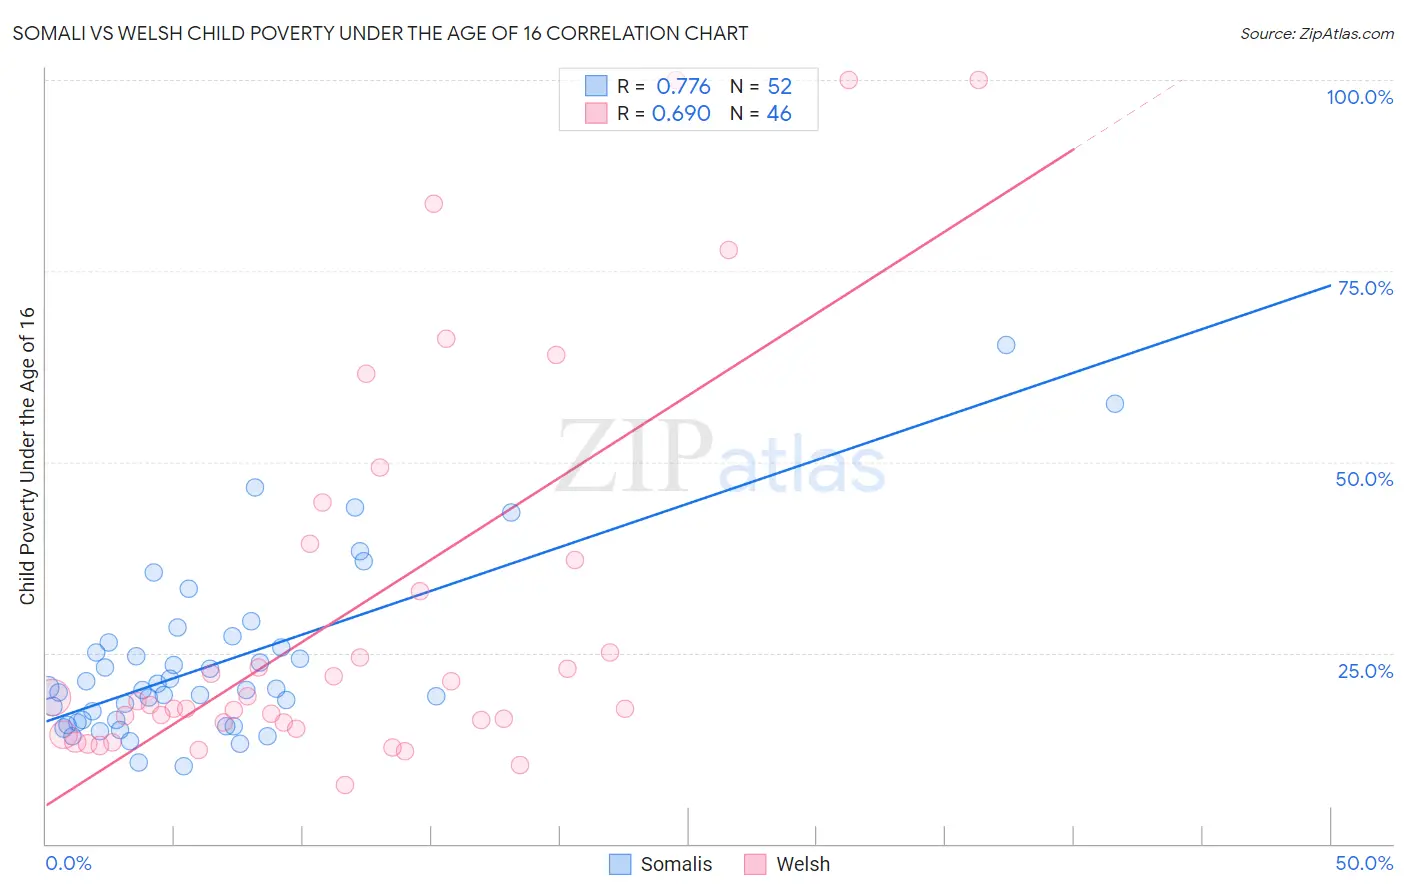
Somali vs Welsh Child Poverty Under the Age of 16 Correlation Chart
The statistical analysis conducted on geographies consisting of 99,170,340 people shows a strong positive correlation between the proportion of Somalis and poverty level among children under the age of 16 in the United States with a correlation coefficient (R) of 0.776 and weighted average of 21.0%. Similarly, the statistical analysis conducted on geographies consisting of 519,115,180 people shows a significant positive correlation between the proportion of Welsh and poverty level among children under the age of 16 in the United States with a correlation coefficient (R) of 0.690 and weighted average of 15.3%, a difference of 37.7%.
Child Poverty Under the Age of 16 Correlation Summary
| Measurement | Somali | Welsh |
| Minimum | 10.2% | 7.7% |
| Maximum | 65.2% | 100.0% |
| Range | 55.1% | 92.3% |
| Mean | 23.7% | 30.8% |
| Median | 20.2% | 18.4% |
| Interquartile 25% (IQ1) | 16.0% | 15.9% |
| Interquartile 75% (IQ3) | 26.1% | 37.1% |
| Interquartile Range (IQR) | 10.1% | 21.2% |
| Standard Deviation (Sample) | 11.3% | 25.9% |
| Standard Deviation (Population) | 11.2% | 25.6% |
Similar Demographics by Child Poverty Under the Age of 16
Demographics Similar to Somalis by Child Poverty Under the Age of 16
In terms of child poverty under the age of 16, the demographic groups most similar to Somalis are Choctaw (21.0%, a difference of 0.050%), Immigrants from Bahamas (21.0%, a difference of 0.090%), Immigrants from Grenada (21.0%, a difference of 0.33%), Indonesian (21.0%, a difference of 0.37%), and Seminole (21.1%, a difference of 0.47%).
| Demographics | Rating | Rank | Child Poverty Under the Age of 16 |
| Hispanics or Latinos | 0.0 /100 | #297 | Tragic 20.8% |
| Arapaho | 0.0 /100 | #298 | Tragic 20.8% |
| Immigrants | Haiti | 0.0 /100 | #299 | Tragic 20.9% |
| Indonesians | 0.0 /100 | #300 | Tragic 21.0% |
| Immigrants | Grenada | 0.0 /100 | #301 | Tragic 21.0% |
| Immigrants | Bahamas | 0.0 /100 | #302 | Tragic 21.0% |
| Choctaw | 0.0 /100 | #303 | Tragic 21.0% |
| Somalis | 0.0 /100 | #304 | Tragic 21.0% |
| Seminole | 0.0 /100 | #305 | Tragic 21.1% |
| Guatemalans | 0.0 /100 | #306 | Tragic 21.2% |
| Immigrants | Central America | 0.0 /100 | #307 | Tragic 21.3% |
| British West Indians | 0.0 /100 | #308 | Tragic 21.3% |
| Immigrants | Mexico | 0.0 /100 | #309 | Tragic 21.5% |
| Bahamians | 0.0 /100 | #310 | Tragic 21.5% |
| Dutch West Indians | 0.0 /100 | #311 | Tragic 21.5% |
Demographics Similar to Welsh by Child Poverty Under the Age of 16
In terms of child poverty under the age of 16, the demographic groups most similar to Welsh are Peruvian (15.3%, a difference of 0.010%), Immigrants from Spain (15.3%, a difference of 0.040%), Immigrants from Vietnam (15.3%, a difference of 0.040%), New Zealander (15.3%, a difference of 0.10%), and Albanian (15.2%, a difference of 0.41%).
| Demographics | Rating | Rank | Child Poverty Under the Age of 16 |
| Armenians | 89.4 /100 | #131 | Excellent 15.2% |
| Canadians | 89.1 /100 | #132 | Excellent 15.2% |
| Immigrants | South Eastern Asia | 89.0 /100 | #133 | Excellent 15.2% |
| Native Hawaiians | 88.7 /100 | #134 | Excellent 15.2% |
| Albanians | 88.6 /100 | #135 | Excellent 15.2% |
| Immigrants | Spain | 87.3 /100 | #136 | Excellent 15.3% |
| Peruvians | 87.2 /100 | #137 | Excellent 15.3% |
| Welsh | 87.2 /100 | #138 | Excellent 15.3% |
| Immigrants | Vietnam | 87.1 /100 | #139 | Excellent 15.3% |
| New Zealanders | 86.9 /100 | #140 | Excellent 15.3% |
| Slavs | 84.2 /100 | #141 | Excellent 15.4% |
| Brazilians | 82.8 /100 | #142 | Excellent 15.4% |
| Icelanders | 82.5 /100 | #143 | Excellent 15.4% |
| Immigrants | Hungary | 81.9 /100 | #144 | Excellent 15.5% |
| Immigrants | Peru | 81.7 /100 | #145 | Excellent 15.5% |