Slavic vs Kenyan Unemployment Among Seniors over 65 years
COMPARE
Slavic
Kenyan
Unemployment Among Seniors over 65 years
Unemployment Among Seniors over 65 years Comparison
Slavs
Kenyans
5.0%
UNEMPLOYMENT AMONG SENIORS OVER 65 YEARS
98.9/ 100
METRIC RATING
78th/ 347
METRIC RANK
4.7%
UNEMPLOYMENT AMONG SENIORS OVER 65 YEARS
100.0/ 100
METRIC RATING
23rd/ 347
METRIC RANK
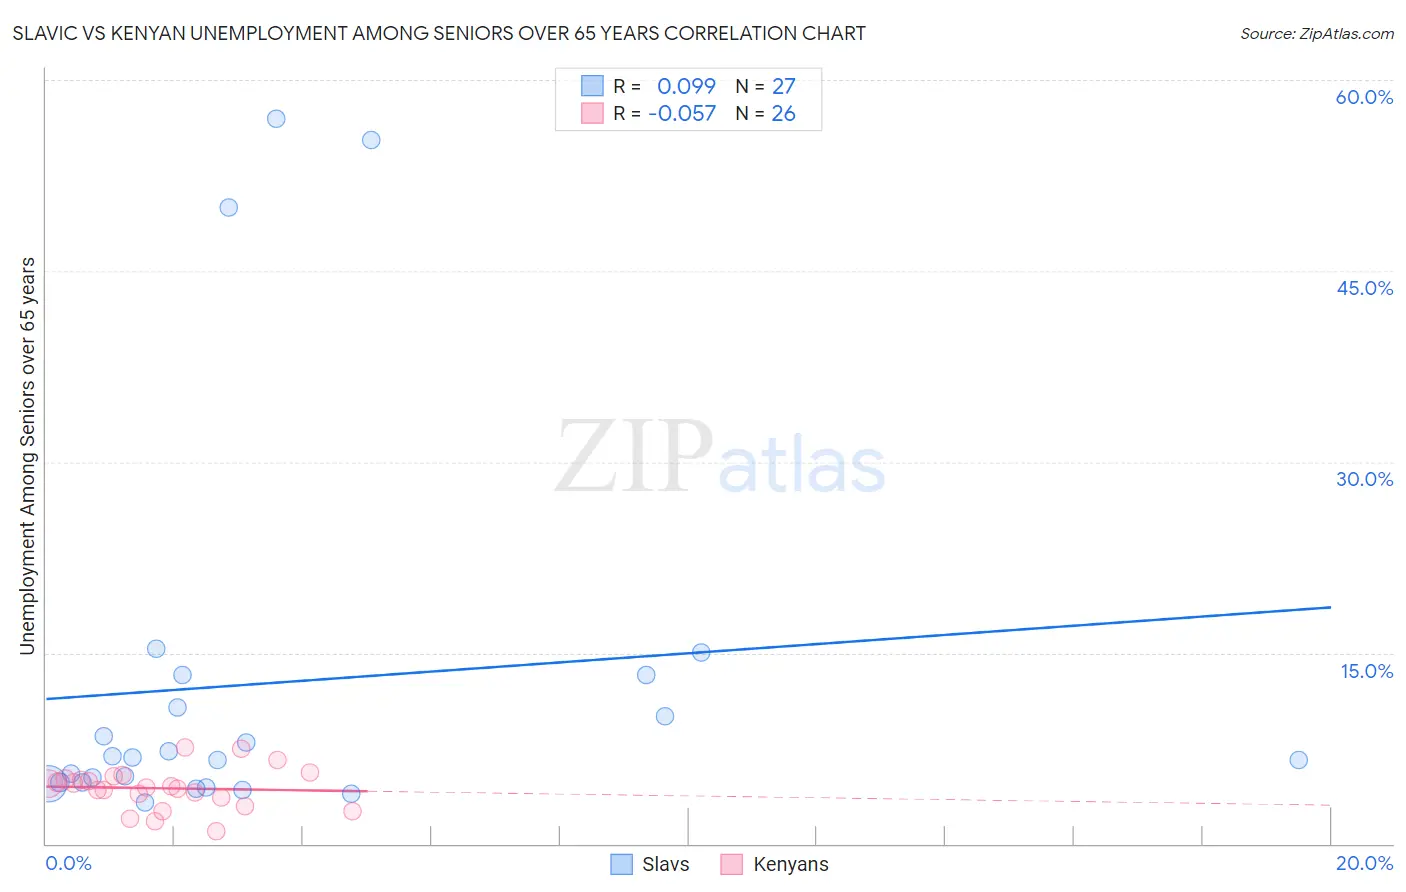
Slavic vs Kenyan Unemployment Among Seniors over 65 years Correlation Chart
The statistical analysis conducted on geographies consisting of 249,750,215 people shows a slight positive correlation between the proportion of Slavs and unemployment rate amomg seniors over the age of 65 in the United States with a correlation coefficient (R) of 0.099 and weighted average of 5.0%. Similarly, the statistical analysis conducted on geographies consisting of 160,795,090 people shows a slight negative correlation between the proportion of Kenyans and unemployment rate amomg seniors over the age of 65 in the United States with a correlation coefficient (R) of -0.057 and weighted average of 4.7%, a difference of 5.2%.
Unemployment Among Seniors over 65 years Correlation Summary
| Measurement | Slavic | Kenyan |
| Minimum | 3.2% | 1.0% |
| Maximum | 57.0% | 7.5% |
| Range | 53.8% | 6.5% |
| Mean | 12.6% | 4.4% |
| Median | 6.8% | 4.5% |
| Interquartile 25% (IQ1) | 4.8% | 3.6% |
| Interquartile 75% (IQ3) | 13.3% | 5.1% |
| Interquartile Range (IQR) | 8.5% | 1.5% |
| Standard Deviation (Sample) | 15.4% | 1.6% |
| Standard Deviation (Population) | 15.1% | 1.6% |
Similar Demographics by Unemployment Among Seniors over 65 years
Demographics Similar to Slavs by Unemployment Among Seniors over 65 years
In terms of unemployment among seniors over 65 years, the demographic groups most similar to Slavs are Immigrants from Netherlands (5.0%, a difference of 0.050%), Immigrants from Ethiopia (5.0%, a difference of 0.15%), Thai (5.0%, a difference of 0.19%), Welsh (5.0%, a difference of 0.20%), and British (4.9%, a difference of 0.24%).
| Demographics | Rating | Rank | Unemployment Among Seniors over 65 years |
| Immigrants | Moldova | 99.4 /100 | #71 | Exceptional 4.9% |
| Nicaraguans | 99.3 /100 | #72 | Exceptional 4.9% |
| Immigrants | Japan | 99.2 /100 | #73 | Exceptional 4.9% |
| Japanese | 99.2 /100 | #74 | Exceptional 4.9% |
| British | 99.1 /100 | #75 | Exceptional 4.9% |
| Welsh | 99.1 /100 | #76 | Exceptional 5.0% |
| Thais | 99.1 /100 | #77 | Exceptional 5.0% |
| Slavs | 98.9 /100 | #78 | Exceptional 5.0% |
| Immigrants | Netherlands | 98.8 /100 | #79 | Exceptional 5.0% |
| Immigrants | Ethiopia | 98.6 /100 | #80 | Exceptional 5.0% |
| Estonians | 98.5 /100 | #81 | Exceptional 5.0% |
| Serbians | 98.4 /100 | #82 | Exceptional 5.0% |
| Immigrants | Zimbabwe | 98.3 /100 | #83 | Exceptional 5.0% |
| Filipinos | 98.3 /100 | #84 | Exceptional 5.0% |
| Immigrants | Hungary | 98.2 /100 | #85 | Exceptional 5.0% |
Demographics Similar to Kenyans by Unemployment Among Seniors over 65 years
In terms of unemployment among seniors over 65 years, the demographic groups most similar to Kenyans are Iraqi (4.7%, a difference of 0.39%), Czech (4.7%, a difference of 0.42%), Norwegian (4.7%, a difference of 0.60%), Tongan (4.7%, a difference of 0.61%), and Immigrants from Nepal (4.7%, a difference of 0.82%).
| Demographics | Rating | Rank | Unemployment Among Seniors over 65 years |
| Immigrants | Burma/Myanmar | 100.0 /100 | #16 | Exceptional 4.6% |
| Creek | 100.0 /100 | #17 | Exceptional 4.6% |
| Immigrants | Eritrea | 100.0 /100 | #18 | Exceptional 4.7% |
| Lebanese | 100.0 /100 | #19 | Exceptional 4.7% |
| Immigrants | Nepal | 100.0 /100 | #20 | Exceptional 4.7% |
| Norwegians | 100.0 /100 | #21 | Exceptional 4.7% |
| Czechs | 100.0 /100 | #22 | Exceptional 4.7% |
| Kenyans | 100.0 /100 | #23 | Exceptional 4.7% |
| Iraqis | 100.0 /100 | #24 | Exceptional 4.7% |
| Tongans | 100.0 /100 | #25 | Exceptional 4.7% |
| Immigrants | Lebanon | 100.0 /100 | #26 | Exceptional 4.8% |
| Houma | 100.0 /100 | #27 | Exceptional 4.8% |
| Ugandans | 100.0 /100 | #28 | Exceptional 4.8% |
| Immigrants | North Macedonia | 100.0 /100 | #29 | Exceptional 4.8% |
| Belgians | 100.0 /100 | #30 | Exceptional 4.8% |