Alaskan Athabascan vs Immigrants from Croatia Cognitive Disability
COMPARE
Alaskan Athabascan
Immigrants from Croatia
Cognitive Disability
Cognitive Disability Comparison
Alaskan Athabascans
Immigrants from Croatia
17.6%
COGNITIVE DISABILITY
6.9/ 100
METRIC RATING
215th/ 347
METRIC RANK
16.4%
COGNITIVE DISABILITY
99.9/ 100
METRIC RATING
26th/ 347
METRIC RANK
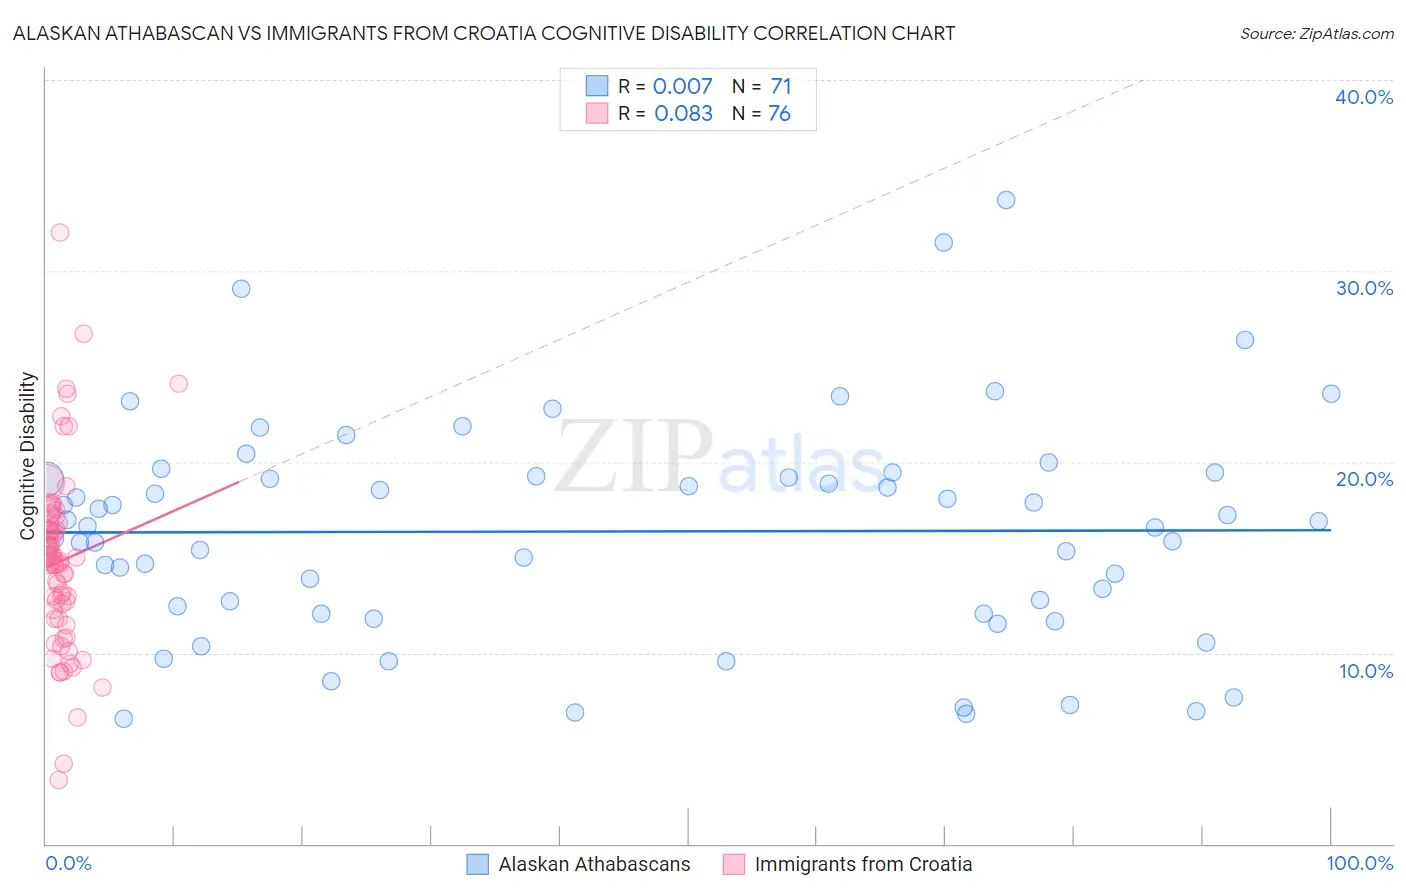
Alaskan Athabascan vs Immigrants from Croatia Cognitive Disability Correlation Chart
The statistical analysis conducted on geographies consisting of 45,820,962 people shows no correlation between the proportion of Alaskan Athabascans and percentage of population with cognitive disability in the United States with a correlation coefficient (R) of 0.007 and weighted average of 17.6%. Similarly, the statistical analysis conducted on geographies consisting of 132,576,983 people shows a slight positive correlation between the proportion of Immigrants from Croatia and percentage of population with cognitive disability in the United States with a correlation coefficient (R) of 0.083 and weighted average of 16.4%, a difference of 7.4%.
Cognitive Disability Correlation Summary
| Measurement | Alaskan Athabascan | Immigrants from Croatia |
| Minimum | 6.5% | 3.4% |
| Maximum | 33.7% | 32.0% |
| Range | 27.2% | 28.6% |
| Mean | 16.4% | 14.8% |
| Median | 16.6% | 14.9% |
| Interquartile 25% (IQ1) | 12.1% | 12.0% |
| Interquartile 75% (IQ3) | 19.2% | 16.6% |
| Interquartile Range (IQR) | 7.2% | 4.6% |
| Standard Deviation (Sample) | 5.7% | 4.7% |
| Standard Deviation (Population) | 5.7% | 4.7% |
Similar Demographics by Cognitive Disability
Demographics Similar to Alaskan Athabascans by Cognitive Disability
In terms of cognitive disability, the demographic groups most similar to Alaskan Athabascans are Immigrants from El Salvador (17.6%, a difference of 0.010%), Okinawan (17.6%, a difference of 0.010%), Salvadoran (17.6%, a difference of 0.020%), Hawaiian (17.6%, a difference of 0.030%), and Immigrants from Oceania (17.6%, a difference of 0.050%).
| Demographics | Rating | Rank | Cognitive Disability |
| Immigrants | Cameroon | 9.3 /100 | #208 | Tragic 17.6% |
| Immigrants | Trinidad and Tobago | 8.7 /100 | #209 | Tragic 17.6% |
| Immigrants | Jamaica | 8.5 /100 | #210 | Tragic 17.6% |
| Taiwanese | 7.7 /100 | #211 | Tragic 17.6% |
| Immigrants | Oceania | 7.3 /100 | #212 | Tragic 17.6% |
| Hawaiians | 7.2 /100 | #213 | Tragic 17.6% |
| Immigrants | El Salvador | 7.0 /100 | #214 | Tragic 17.6% |
| Alaskan Athabascans | 6.9 /100 | #215 | Tragic 17.6% |
| Okinawans | 6.8 /100 | #216 | Tragic 17.6% |
| Salvadorans | 6.7 /100 | #217 | Tragic 17.6% |
| Icelanders | 6.4 /100 | #218 | Tragic 17.6% |
| Immigrants | Sierra Leone | 6.3 /100 | #219 | Tragic 17.6% |
| Zimbabweans | 6.1 /100 | #220 | Tragic 17.6% |
| Moroccans | 5.9 /100 | #221 | Tragic 17.6% |
| Central Americans | 4.5 /100 | #222 | Tragic 17.7% |
Demographics Similar to Immigrants from Croatia by Cognitive Disability
In terms of cognitive disability, the demographic groups most similar to Immigrants from Croatia are Immigrants from Pakistan (16.4%, a difference of 0.020%), Polish (16.4%, a difference of 0.020%), Luxembourger (16.4%, a difference of 0.030%), Filipino (16.4%, a difference of 0.050%), and Czech (16.4%, a difference of 0.050%).
| Demographics | Rating | Rank | Cognitive Disability |
| Immigrants | Bolivia | 100.0 /100 | #19 | Exceptional 16.3% |
| Bulgarians | 100.0 /100 | #20 | Exceptional 16.3% |
| Immigrants | Cuba | 100.0 /100 | #21 | Exceptional 16.3% |
| Immigrants | South Central Asia | 99.9 /100 | #22 | Exceptional 16.4% |
| Croatians | 99.9 /100 | #23 | Exceptional 16.4% |
| Immigrants | Argentina | 99.9 /100 | #24 | Exceptional 16.4% |
| Luxembourgers | 99.9 /100 | #25 | Exceptional 16.4% |
| Immigrants | Croatia | 99.9 /100 | #26 | Exceptional 16.4% |
| Immigrants | Pakistan | 99.9 /100 | #27 | Exceptional 16.4% |
| Poles | 99.9 /100 | #28 | Exceptional 16.4% |
| Filipinos | 99.9 /100 | #29 | Exceptional 16.4% |
| Czechs | 99.9 /100 | #30 | Exceptional 16.4% |
| Immigrants | Romania | 99.9 /100 | #31 | Exceptional 16.4% |
| Immigrants | Israel | 99.9 /100 | #32 | Exceptional 16.4% |
| Italians | 99.9 /100 | #33 | Exceptional 16.4% |