Honduran vs Immigrants from Croatia Cognitive Disability
COMPARE
Honduran
Immigrants from Croatia
Cognitive Disability
Cognitive Disability Comparison
Hondurans
Immigrants from Croatia
18.0%
COGNITIVE DISABILITY
0.3/ 100
METRIC RATING
269th/ 347
METRIC RANK
16.4%
COGNITIVE DISABILITY
99.9/ 100
METRIC RATING
26th/ 347
METRIC RANK
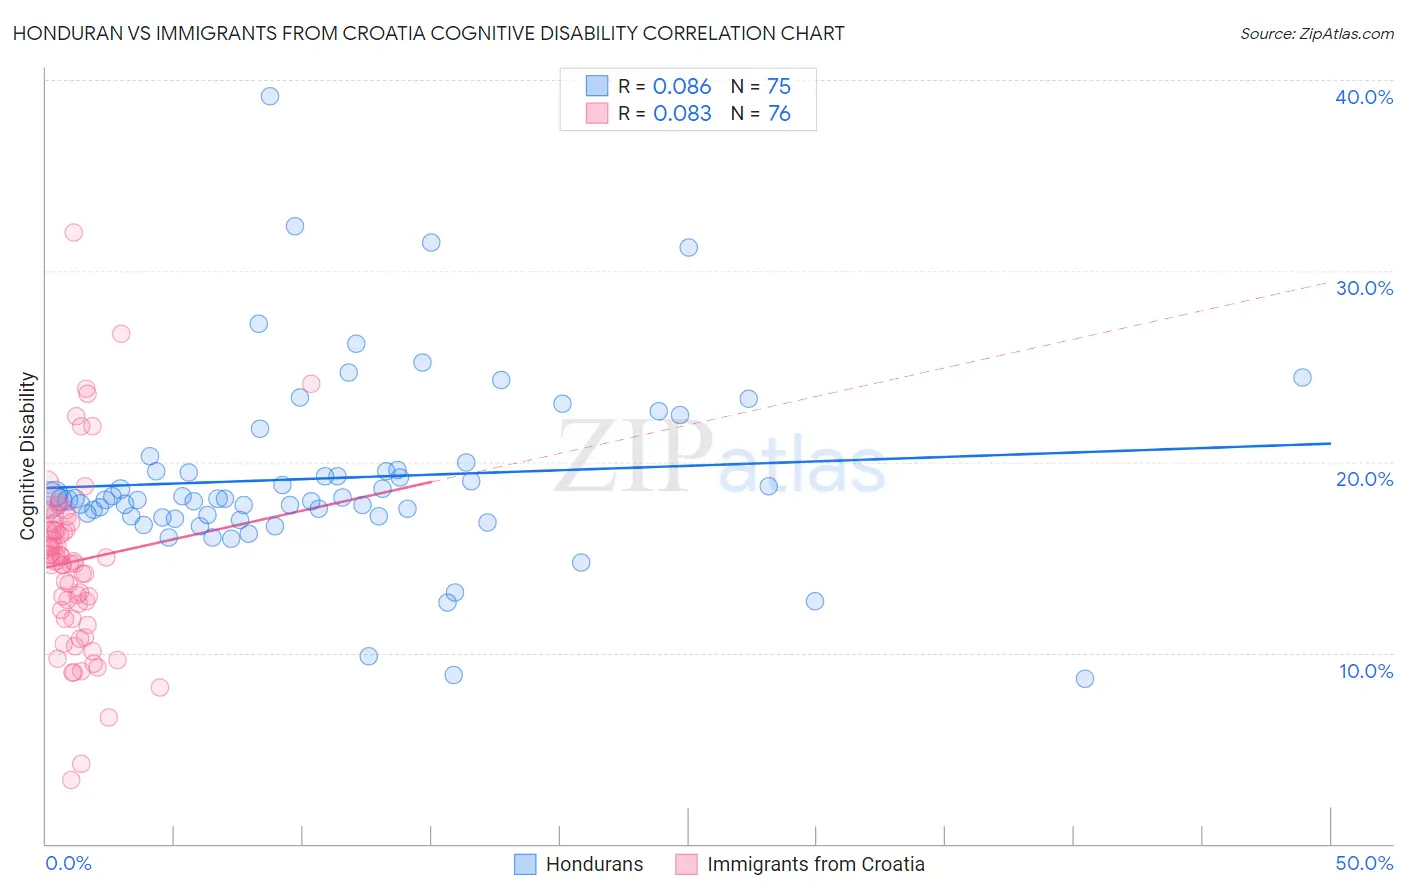
Honduran vs Immigrants from Croatia Cognitive Disability Correlation Chart
The statistical analysis conducted on geographies consisting of 357,766,918 people shows a slight positive correlation between the proportion of Hondurans and percentage of population with cognitive disability in the United States with a correlation coefficient (R) of 0.086 and weighted average of 18.0%. Similarly, the statistical analysis conducted on geographies consisting of 132,576,983 people shows a slight positive correlation between the proportion of Immigrants from Croatia and percentage of population with cognitive disability in the United States with a correlation coefficient (R) of 0.083 and weighted average of 16.4%, a difference of 9.9%.
Cognitive Disability Correlation Summary
| Measurement | Honduran | Immigrants from Croatia |
| Minimum | 8.7% | 3.4% |
| Maximum | 39.1% | 32.0% |
| Range | 30.5% | 28.6% |
| Mean | 19.1% | 14.8% |
| Median | 18.0% | 14.9% |
| Interquartile 25% (IQ1) | 17.1% | 12.0% |
| Interquartile 75% (IQ3) | 19.6% | 16.6% |
| Interquartile Range (IQR) | 2.5% | 4.6% |
| Standard Deviation (Sample) | 4.9% | 4.7% |
| Standard Deviation (Population) | 4.8% | 4.7% |
Similar Demographics by Cognitive Disability
Demographics Similar to Hondurans by Cognitive Disability
In terms of cognitive disability, the demographic groups most similar to Hondurans are Immigrants from Bahamas (18.0%, a difference of 0.010%), Potawatomi (18.0%, a difference of 0.080%), Immigrants from Honduras (18.0%, a difference of 0.10%), Cherokee (18.0%, a difference of 0.14%), and Nepalese (18.0%, a difference of 0.15%).
| Demographics | Rating | Rank | Cognitive Disability |
| Sierra Leoneans | 0.4 /100 | #262 | Tragic 17.9% |
| Immigrants | Barbados | 0.4 /100 | #263 | Tragic 17.9% |
| Menominee | 0.4 /100 | #264 | Tragic 18.0% |
| Spanish Americans | 0.4 /100 | #265 | Tragic 18.0% |
| Belizeans | 0.4 /100 | #266 | Tragic 18.0% |
| Nepalese | 0.3 /100 | #267 | Tragic 18.0% |
| Cherokee | 0.3 /100 | #268 | Tragic 18.0% |
| Hondurans | 0.3 /100 | #269 | Tragic 18.0% |
| Immigrants | Bahamas | 0.3 /100 | #270 | Tragic 18.0% |
| Potawatomi | 0.2 /100 | #271 | Tragic 18.0% |
| Immigrants | Honduras | 0.2 /100 | #272 | Tragic 18.0% |
| Immigrants | Nepal | 0.2 /100 | #273 | Tragic 18.0% |
| Immigrants | Nigeria | 0.2 /100 | #274 | Tragic 18.0% |
| Immigrants | Laos | 0.2 /100 | #275 | Tragic 18.1% |
| Yuman | 0.2 /100 | #276 | Tragic 18.1% |
Demographics Similar to Immigrants from Croatia by Cognitive Disability
In terms of cognitive disability, the demographic groups most similar to Immigrants from Croatia are Immigrants from Pakistan (16.4%, a difference of 0.020%), Polish (16.4%, a difference of 0.020%), Luxembourger (16.4%, a difference of 0.030%), Filipino (16.4%, a difference of 0.050%), and Czech (16.4%, a difference of 0.050%).
| Demographics | Rating | Rank | Cognitive Disability |
| Immigrants | Bolivia | 100.0 /100 | #19 | Exceptional 16.3% |
| Bulgarians | 100.0 /100 | #20 | Exceptional 16.3% |
| Immigrants | Cuba | 100.0 /100 | #21 | Exceptional 16.3% |
| Immigrants | South Central Asia | 99.9 /100 | #22 | Exceptional 16.4% |
| Croatians | 99.9 /100 | #23 | Exceptional 16.4% |
| Immigrants | Argentina | 99.9 /100 | #24 | Exceptional 16.4% |
| Luxembourgers | 99.9 /100 | #25 | Exceptional 16.4% |
| Immigrants | Croatia | 99.9 /100 | #26 | Exceptional 16.4% |
| Immigrants | Pakistan | 99.9 /100 | #27 | Exceptional 16.4% |
| Poles | 99.9 /100 | #28 | Exceptional 16.4% |
| Filipinos | 99.9 /100 | #29 | Exceptional 16.4% |
| Czechs | 99.9 /100 | #30 | Exceptional 16.4% |
| Immigrants | Romania | 99.9 /100 | #31 | Exceptional 16.4% |
| Immigrants | Israel | 99.9 /100 | #32 | Exceptional 16.4% |
| Italians | 99.9 /100 | #33 | Exceptional 16.4% |