Australian vs Immigrants from Croatia Cognitive Disability
COMPARE
Australian
Immigrants from Croatia
Cognitive Disability
Cognitive Disability Comparison
Australians
Immigrants from Croatia
17.2%
COGNITIVE DISABILITY
72.4/ 100
METRIC RATING
160th/ 347
METRIC RANK
16.4%
COGNITIVE DISABILITY
99.9/ 100
METRIC RATING
26th/ 347
METRIC RANK
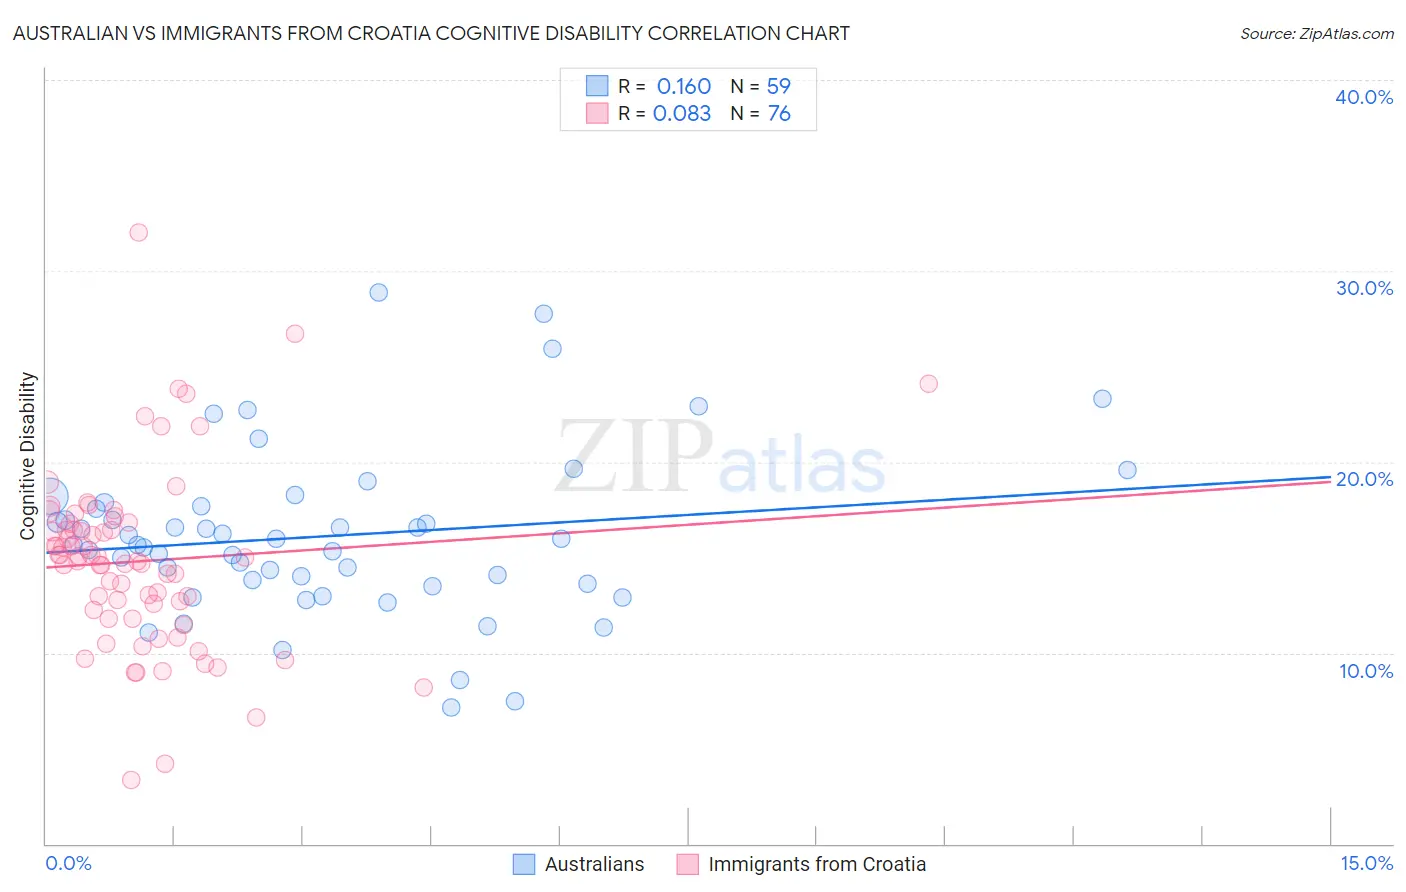
Australian vs Immigrants from Croatia Cognitive Disability Correlation Chart
The statistical analysis conducted on geographies consisting of 224,142,484 people shows a poor positive correlation between the proportion of Australians and percentage of population with cognitive disability in the United States with a correlation coefficient (R) of 0.160 and weighted average of 17.2%. Similarly, the statistical analysis conducted on geographies consisting of 132,576,983 people shows a slight positive correlation between the proportion of Immigrants from Croatia and percentage of population with cognitive disability in the United States with a correlation coefficient (R) of 0.083 and weighted average of 16.4%, a difference of 4.8%.
Cognitive Disability Correlation Summary
| Measurement | Australian | Immigrants from Croatia |
| Minimum | 7.1% | 3.4% |
| Maximum | 28.9% | 32.0% |
| Range | 21.7% | 28.6% |
| Mean | 16.1% | 14.8% |
| Median | 15.7% | 14.9% |
| Interquartile 25% (IQ1) | 13.6% | 12.0% |
| Interquartile 75% (IQ3) | 17.7% | 16.6% |
| Interquartile Range (IQR) | 4.1% | 4.6% |
| Standard Deviation (Sample) | 4.3% | 4.7% |
| Standard Deviation (Population) | 4.3% | 4.7% |
Similar Demographics by Cognitive Disability
Demographics Similar to Australians by Cognitive Disability
In terms of cognitive disability, the demographic groups most similar to Australians are American (17.2%, a difference of 0.010%), Immigrants from Latvia (17.2%, a difference of 0.030%), Yugoslavian (17.2%, a difference of 0.030%), Immigrants from Switzerland (17.2%, a difference of 0.030%), and Celtic (17.1%, a difference of 0.060%).
| Demographics | Rating | Rank | Cognitive Disability |
| Immigrants | Kazakhstan | 80.5 /100 | #153 | Excellent 17.1% |
| Immigrants | Malaysia | 79.3 /100 | #154 | Good 17.1% |
| Brazilians | 78.9 /100 | #155 | Good 17.1% |
| Sri Lankans | 78.9 /100 | #156 | Good 17.1% |
| Immigrants | Australia | 76.0 /100 | #157 | Good 17.1% |
| Celtics | 74.1 /100 | #158 | Good 17.1% |
| Immigrants | Latvia | 73.2 /100 | #159 | Good 17.2% |
| Australians | 72.4 /100 | #160 | Good 17.2% |
| Americans | 72.2 /100 | #161 | Good 17.2% |
| Yugoslavians | 71.6 /100 | #162 | Good 17.2% |
| Immigrants | Switzerland | 71.5 /100 | #163 | Good 17.2% |
| Armenians | 70.1 /100 | #164 | Good 17.2% |
| Immigrants | Albania | 64.9 /100 | #165 | Good 17.2% |
| Immigrants | Ecuador | 64.4 /100 | #166 | Good 17.2% |
| Immigrants | Syria | 63.5 /100 | #167 | Good 17.2% |
Demographics Similar to Immigrants from Croatia by Cognitive Disability
In terms of cognitive disability, the demographic groups most similar to Immigrants from Croatia are Immigrants from Pakistan (16.4%, a difference of 0.020%), Polish (16.4%, a difference of 0.020%), Luxembourger (16.4%, a difference of 0.030%), Filipino (16.4%, a difference of 0.050%), and Czech (16.4%, a difference of 0.050%).
| Demographics | Rating | Rank | Cognitive Disability |
| Immigrants | Bolivia | 100.0 /100 | #19 | Exceptional 16.3% |
| Bulgarians | 100.0 /100 | #20 | Exceptional 16.3% |
| Immigrants | Cuba | 100.0 /100 | #21 | Exceptional 16.3% |
| Immigrants | South Central Asia | 99.9 /100 | #22 | Exceptional 16.4% |
| Croatians | 99.9 /100 | #23 | Exceptional 16.4% |
| Immigrants | Argentina | 99.9 /100 | #24 | Exceptional 16.4% |
| Luxembourgers | 99.9 /100 | #25 | Exceptional 16.4% |
| Immigrants | Croatia | 99.9 /100 | #26 | Exceptional 16.4% |
| Immigrants | Pakistan | 99.9 /100 | #27 | Exceptional 16.4% |
| Poles | 99.9 /100 | #28 | Exceptional 16.4% |
| Filipinos | 99.9 /100 | #29 | Exceptional 16.4% |
| Czechs | 99.9 /100 | #30 | Exceptional 16.4% |
| Immigrants | Romania | 99.9 /100 | #31 | Exceptional 16.4% |
| Immigrants | Israel | 99.9 /100 | #32 | Exceptional 16.4% |
| Italians | 99.9 /100 | #33 | Exceptional 16.4% |