Shoshone vs Paraguayan Disability Age 5 to 17
COMPARE
Shoshone
Paraguayan
Disability Age 5 to 17
Disability Age 5 to 17 Comparison
Shoshone
Paraguayans
5.6%
DISABILITY AGE 5 TO 17
49.4/ 100
METRIC RATING
175th/ 347
METRIC RANK
5.1%
DISABILITY AGE 5 TO 17
99.9/ 100
METRIC RATING
54th/ 347
METRIC RANK
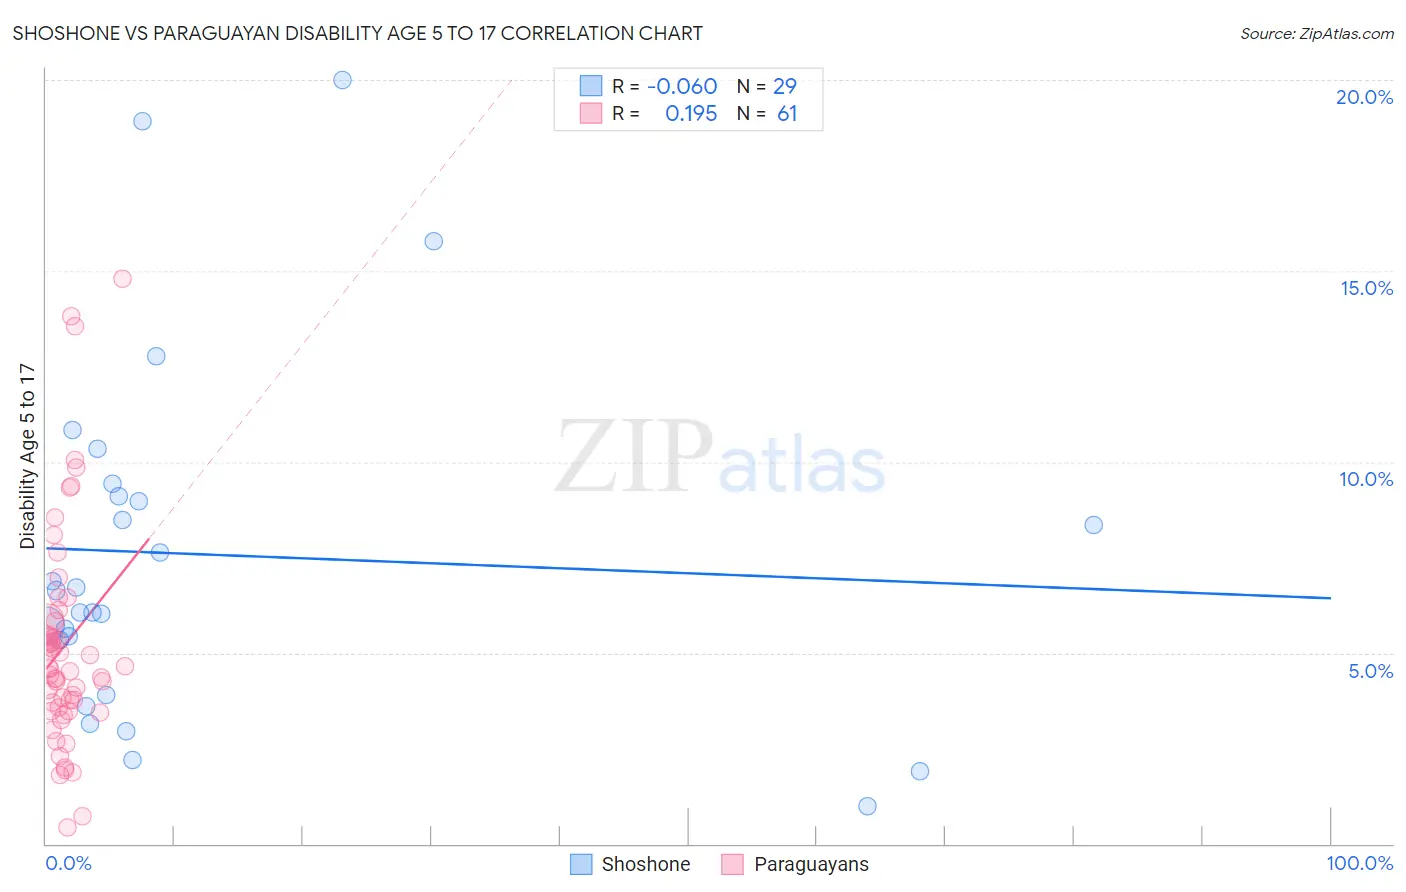
Shoshone vs Paraguayan Disability Age 5 to 17 Correlation Chart
The statistical analysis conducted on geographies consisting of 66,499,721 people shows a slight negative correlation between the proportion of Shoshone and percentage of population with a disability between the ages 5 and 17 in the United States with a correlation coefficient (R) of -0.060 and weighted average of 5.6%. Similarly, the statistical analysis conducted on geographies consisting of 94,920,755 people shows a poor positive correlation between the proportion of Paraguayans and percentage of population with a disability between the ages 5 and 17 in the United States with a correlation coefficient (R) of 0.195 and weighted average of 5.1%, a difference of 9.6%.
Disability Age 5 to 17 Correlation Summary
| Measurement | Shoshone | Paraguayan |
| Minimum | 0.97% | 0.43% |
| Maximum | 20.0% | 14.8% |
| Range | 19.0% | 14.4% |
| Mean | 7.6% | 5.2% |
| Median | 6.6% | 4.6% |
| Interquartile 25% (IQ1) | 4.6% | 3.5% |
| Interquartile 75% (IQ3) | 9.3% | 5.8% |
| Interquartile Range (IQR) | 4.7% | 2.3% |
| Standard Deviation (Sample) | 4.7% | 2.9% |
| Standard Deviation (Population) | 4.6% | 2.9% |
Similar Demographics by Disability Age 5 to 17
Demographics Similar to Shoshone by Disability Age 5 to 17
In terms of disability age 5 to 17, the demographic groups most similar to Shoshone are Immigrants from Central America (5.6%, a difference of 0.0%), Costa Rican (5.6%, a difference of 0.030%), Uruguayan (5.6%, a difference of 0.080%), Immigrants from Western Europe (5.6%, a difference of 0.080%), and Immigrants from Trinidad and Tobago (5.6%, a difference of 0.090%).
| Demographics | Rating | Rank | Disability Age 5 to 17 |
| Iraqis | 56.0 /100 | #168 | Average 5.6% |
| Immigrants | Norway | 55.7 /100 | #169 | Average 5.6% |
| Serbians | 54.0 /100 | #170 | Average 5.6% |
| Immigrants | Iraq | 53.9 /100 | #171 | Average 5.6% |
| Ukrainians | 51.5 /100 | #172 | Average 5.6% |
| Uruguayans | 51.0 /100 | #173 | Average 5.6% |
| Costa Ricans | 50.0 /100 | #174 | Average 5.6% |
| Shoshone | 49.4 /100 | #175 | Average 5.6% |
| Immigrants | Central America | 49.4 /100 | #176 | Average 5.6% |
| Immigrants | Western Europe | 47.8 /100 | #177 | Average 5.6% |
| Immigrants | Trinidad and Tobago | 47.6 /100 | #178 | Average 5.6% |
| Immigrants | Barbados | 40.5 /100 | #179 | Average 5.6% |
| Immigrants | Uruguay | 37.7 /100 | #180 | Fair 5.6% |
| Immigrants | England | 36.4 /100 | #181 | Fair 5.6% |
| Mexican American Indians | 35.2 /100 | #182 | Fair 5.6% |
Demographics Similar to Paraguayans by Disability Age 5 to 17
In terms of disability age 5 to 17, the demographic groups most similar to Paraguayans are Immigrants from Lithuania (5.1%, a difference of 0.030%), Laotian (5.1%, a difference of 0.040%), Immigrants from Turkey (5.1%, a difference of 0.060%), Immigrants from Fiji (5.1%, a difference of 0.080%), and Turkish (5.1%, a difference of 0.17%).
| Demographics | Rating | Rank | Disability Age 5 to 17 |
| Vietnamese | 100.0 /100 | #47 | Exceptional 5.1% |
| Koreans | 100.0 /100 | #48 | Exceptional 5.1% |
| Immigrants | Western Asia | 100.0 /100 | #49 | Exceptional 5.1% |
| Argentineans | 99.9 /100 | #50 | Exceptional 5.1% |
| Turks | 99.9 /100 | #51 | Exceptional 5.1% |
| Immigrants | Fiji | 99.9 /100 | #52 | Exceptional 5.1% |
| Immigrants | Lithuania | 99.9 /100 | #53 | Exceptional 5.1% |
| Paraguayans | 99.9 /100 | #54 | Exceptional 5.1% |
| Laotians | 99.9 /100 | #55 | Exceptional 5.1% |
| Immigrants | Turkey | 99.9 /100 | #56 | Exceptional 5.1% |
| Immigrants | Poland | 99.9 /100 | #57 | Exceptional 5.1% |
| Immigrants | Ukraine | 99.9 /100 | #58 | Exceptional 5.1% |
| Immigrants | North Macedonia | 99.9 /100 | #59 | Exceptional 5.1% |
| Immigrants | Eastern Europe | 99.9 /100 | #60 | Exceptional 5.1% |
| Immigrants | Switzerland | 99.8 /100 | #61 | Exceptional 5.2% |