New Zealander vs Paraguayan Disability Age 5 to 17
COMPARE
New Zealander
Paraguayan
Disability Age 5 to 17
Disability Age 5 to 17 Comparison
New Zealanders
Paraguayans
5.4%
DISABILITY AGE 5 TO 17
95.0/ 100
METRIC RATING
126th/ 347
METRIC RANK
5.1%
DISABILITY AGE 5 TO 17
99.9/ 100
METRIC RATING
54th/ 347
METRIC RANK
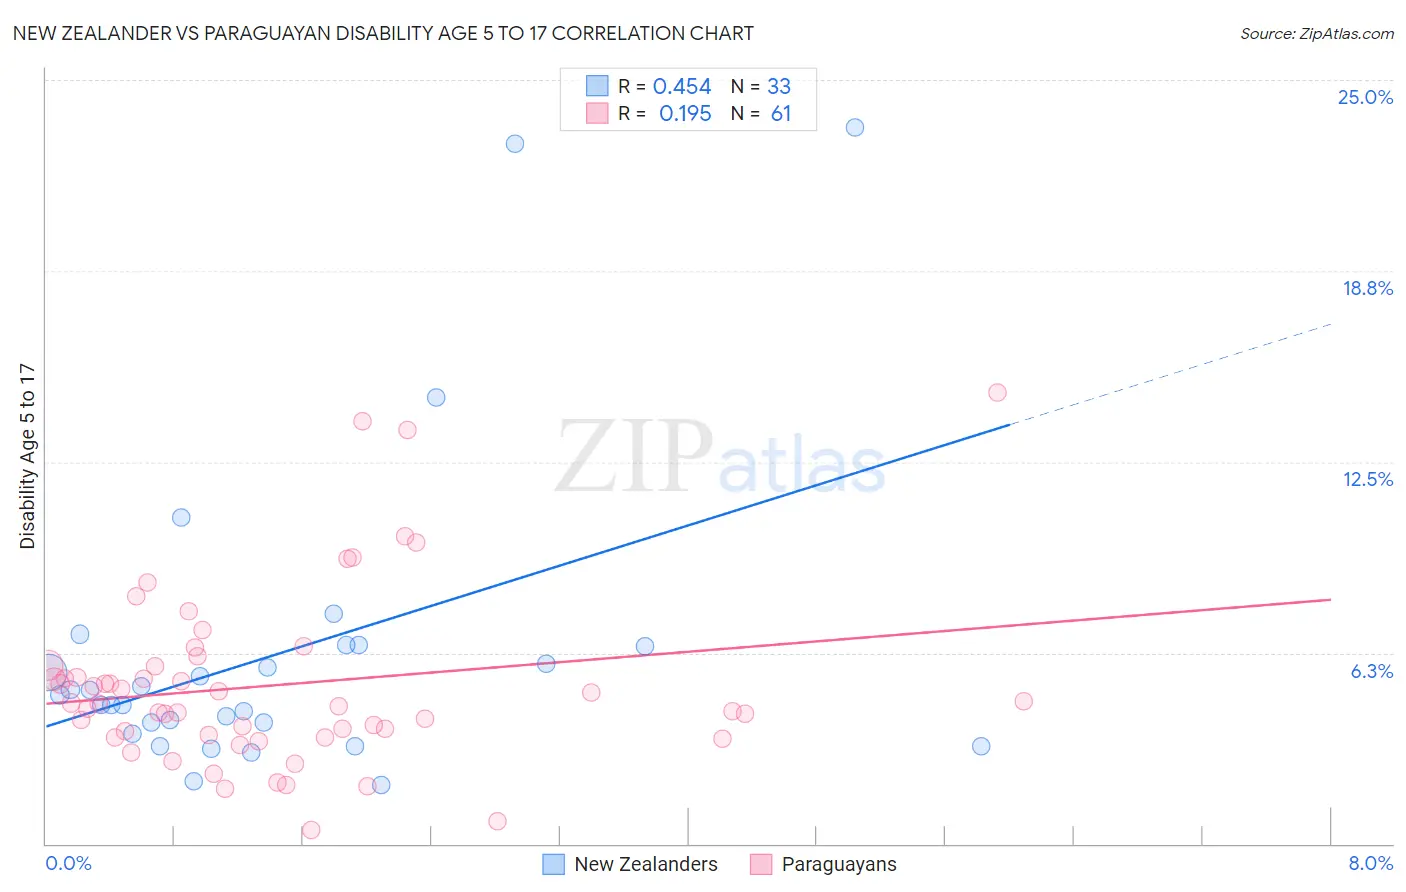
New Zealander vs Paraguayan Disability Age 5 to 17 Correlation Chart
The statistical analysis conducted on geographies consisting of 106,604,029 people shows a moderate positive correlation between the proportion of New Zealanders and percentage of population with a disability between the ages 5 and 17 in the United States with a correlation coefficient (R) of 0.454 and weighted average of 5.4%. Similarly, the statistical analysis conducted on geographies consisting of 94,920,755 people shows a poor positive correlation between the proportion of Paraguayans and percentage of population with a disability between the ages 5 and 17 in the United States with a correlation coefficient (R) of 0.195 and weighted average of 5.1%, a difference of 5.6%.
Disability Age 5 to 17 Correlation Summary
| Measurement | New Zealander | Paraguayan |
| Minimum | 1.9% | 0.43% |
| Maximum | 23.4% | 14.8% |
| Range | 21.5% | 14.4% |
| Mean | 6.2% | 5.2% |
| Median | 4.9% | 4.6% |
| Interquartile 25% (IQ1) | 3.8% | 3.5% |
| Interquartile 75% (IQ3) | 6.5% | 5.8% |
| Interquartile Range (IQR) | 2.7% | 2.3% |
| Standard Deviation (Sample) | 5.0% | 2.9% |
| Standard Deviation (Population) | 4.9% | 2.9% |
Similar Demographics by Disability Age 5 to 17
Demographics Similar to New Zealanders by Disability Age 5 to 17
In terms of disability age 5 to 17, the demographic groups most similar to New Zealanders are Latvian (5.4%, a difference of 0.0%), Immigrants from Chile (5.4%, a difference of 0.010%), Crow (5.4%, a difference of 0.020%), Immigrants from Venezuela (5.4%, a difference of 0.12%), and Immigrants from Ethiopia (5.4%, a difference of 0.16%).
| Demographics | Rating | Rank | Disability Age 5 to 17 |
| Immigrants | South America | 97.1 /100 | #119 | Exceptional 5.4% |
| Immigrants | Immigrants | 97.0 /100 | #120 | Exceptional 5.4% |
| Maltese | 96.0 /100 | #121 | Exceptional 5.4% |
| Chileans | 95.8 /100 | #122 | Exceptional 5.4% |
| Immigrants | Ethiopia | 95.5 /100 | #123 | Exceptional 5.4% |
| Crow | 95.0 /100 | #124 | Exceptional 5.4% |
| Immigrants | Chile | 95.0 /100 | #125 | Exceptional 5.4% |
| New Zealanders | 95.0 /100 | #126 | Exceptional 5.4% |
| Latvians | 95.0 /100 | #127 | Exceptional 5.4% |
| Immigrants | Venezuela | 94.5 /100 | #128 | Exceptional 5.4% |
| Romanians | 94.1 /100 | #129 | Exceptional 5.4% |
| Immigrants | Bulgaria | 94.0 /100 | #130 | Exceptional 5.4% |
| Arabs | 92.9 /100 | #131 | Exceptional 5.4% |
| Immigrants | Colombia | 92.9 /100 | #132 | Exceptional 5.4% |
| Venezuelans | 92.7 /100 | #133 | Exceptional 5.4% |
Demographics Similar to Paraguayans by Disability Age 5 to 17
In terms of disability age 5 to 17, the demographic groups most similar to Paraguayans are Immigrants from Lithuania (5.1%, a difference of 0.030%), Laotian (5.1%, a difference of 0.040%), Immigrants from Turkey (5.1%, a difference of 0.060%), Immigrants from Fiji (5.1%, a difference of 0.080%), and Turkish (5.1%, a difference of 0.17%).
| Demographics | Rating | Rank | Disability Age 5 to 17 |
| Vietnamese | 100.0 /100 | #47 | Exceptional 5.1% |
| Koreans | 100.0 /100 | #48 | Exceptional 5.1% |
| Immigrants | Western Asia | 100.0 /100 | #49 | Exceptional 5.1% |
| Argentineans | 99.9 /100 | #50 | Exceptional 5.1% |
| Turks | 99.9 /100 | #51 | Exceptional 5.1% |
| Immigrants | Fiji | 99.9 /100 | #52 | Exceptional 5.1% |
| Immigrants | Lithuania | 99.9 /100 | #53 | Exceptional 5.1% |
| Paraguayans | 99.9 /100 | #54 | Exceptional 5.1% |
| Laotians | 99.9 /100 | #55 | Exceptional 5.1% |
| Immigrants | Turkey | 99.9 /100 | #56 | Exceptional 5.1% |
| Immigrants | Poland | 99.9 /100 | #57 | Exceptional 5.1% |
| Immigrants | Ukraine | 99.9 /100 | #58 | Exceptional 5.1% |
| Immigrants | North Macedonia | 99.9 /100 | #59 | Exceptional 5.1% |
| Immigrants | Eastern Europe | 99.9 /100 | #60 | Exceptional 5.1% |
| Immigrants | Switzerland | 99.8 /100 | #61 | Exceptional 5.2% |