Shoshone vs Zimbabwean Disability Age 5 to 17
COMPARE
Shoshone
Zimbabwean
Disability Age 5 to 17
Disability Age 5 to 17 Comparison
Shoshone
Zimbabweans
5.6%
DISABILITY AGE 5 TO 17
49.4/ 100
METRIC RATING
175th/ 347
METRIC RANK
5.5%
DISABILITY AGE 5 TO 17
67.2/ 100
METRIC RATING
162nd/ 347
METRIC RANK
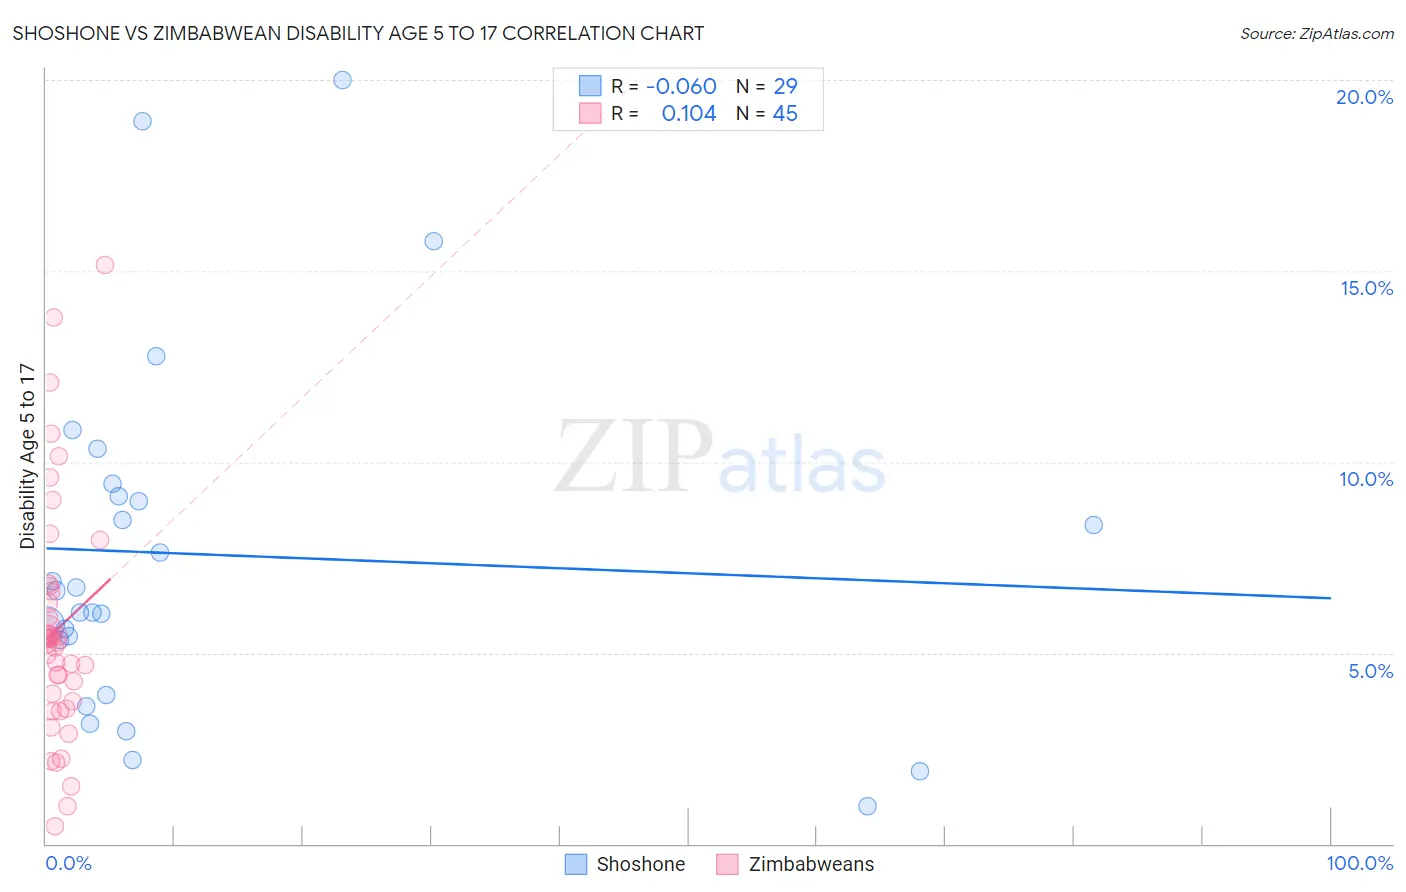
Shoshone vs Zimbabwean Disability Age 5 to 17 Correlation Chart
The statistical analysis conducted on geographies consisting of 66,499,721 people shows a slight negative correlation between the proportion of Shoshone and percentage of population with a disability between the ages 5 and 17 in the United States with a correlation coefficient (R) of -0.060 and weighted average of 5.6%. Similarly, the statistical analysis conducted on geographies consisting of 69,117,127 people shows a poor positive correlation between the proportion of Zimbabweans and percentage of population with a disability between the ages 5 and 17 in the United States with a correlation coefficient (R) of 0.104 and weighted average of 5.5%, a difference of 0.92%.
Disability Age 5 to 17 Correlation Summary
| Measurement | Shoshone | Zimbabwean |
| Minimum | 0.97% | 0.47% |
| Maximum | 20.0% | 15.2% |
| Range | 19.0% | 14.7% |
| Mean | 7.6% | 5.6% |
| Median | 6.6% | 5.3% |
| Interquartile 25% (IQ1) | 4.6% | 3.6% |
| Interquartile 75% (IQ3) | 9.3% | 6.7% |
| Interquartile Range (IQR) | 4.7% | 3.1% |
| Standard Deviation (Sample) | 4.7% | 3.1% |
| Standard Deviation (Population) | 4.6% | 3.1% |
Demographics Similar to Shoshone and Zimbabweans by Disability Age 5 to 17
In terms of disability age 5 to 17, the demographic groups most similar to Shoshone are Immigrants from Central America (5.6%, a difference of 0.0%), Costa Rican (5.6%, a difference of 0.030%), Uruguayan (5.6%, a difference of 0.080%), Immigrants from Western Europe (5.6%, a difference of 0.080%), and Immigrants from Trinidad and Tobago (5.6%, a difference of 0.090%). Similarly, the demographic groups most similar to Zimbabweans are Immigrants from Saudi Arabia (5.5%, a difference of 0.11%), Immigrants from Southern Europe (5.6%, a difference of 0.18%), Immigrants from Scotland (5.6%, a difference of 0.29%), Lebanese (5.6%, a difference of 0.31%), and Greek (5.6%, a difference of 0.36%).
| Demographics | Rating | Rank | Disability Age 5 to 17 |
| Immigrants | Nepal | 77.1 /100 | #158 | Good 5.5% |
| Immigrants | Zimbabwe | 75.3 /100 | #159 | Good 5.5% |
| South Africans | 73.3 /100 | #160 | Good 5.5% |
| Immigrants | Saudi Arabia | 69.1 /100 | #161 | Good 5.5% |
| Zimbabweans | 67.2 /100 | #162 | Good 5.5% |
| Immigrants | Southern Europe | 64.0 /100 | #163 | Good 5.6% |
| Immigrants | Scotland | 61.9 /100 | #164 | Good 5.6% |
| Lebanese | 61.4 /100 | #165 | Good 5.6% |
| Greeks | 60.6 /100 | #166 | Good 5.6% |
| Immigrants | Burma/Myanmar | 59.3 /100 | #167 | Average 5.6% |
| Iraqis | 56.0 /100 | #168 | Average 5.6% |
| Immigrants | Norway | 55.7 /100 | #169 | Average 5.6% |
| Serbians | 54.0 /100 | #170 | Average 5.6% |
| Immigrants | Iraq | 53.9 /100 | #171 | Average 5.6% |
| Ukrainians | 51.5 /100 | #172 | Average 5.6% |
| Uruguayans | 51.0 /100 | #173 | Average 5.6% |
| Costa Ricans | 50.0 /100 | #174 | Average 5.6% |
| Shoshone | 49.4 /100 | #175 | Average 5.6% |
| Immigrants | Central America | 49.4 /100 | #176 | Average 5.6% |
| Immigrants | Western Europe | 47.8 /100 | #177 | Average 5.6% |
| Immigrants | Trinidad and Tobago | 47.6 /100 | #178 | Average 5.6% |