Shoshone vs Immigrants from Western Africa Cognitive Disability
COMPARE
Shoshone
Immigrants from Western Africa
Cognitive Disability
Cognitive Disability Comparison
Shoshone
Immigrants from Western Africa
17.3%
COGNITIVE DISABILITY
49.2/ 100
METRIC RATING
176th/ 347
METRIC RANK
18.4%
COGNITIVE DISABILITY
0.0/ 100
METRIC RATING
308th/ 347
METRIC RANK
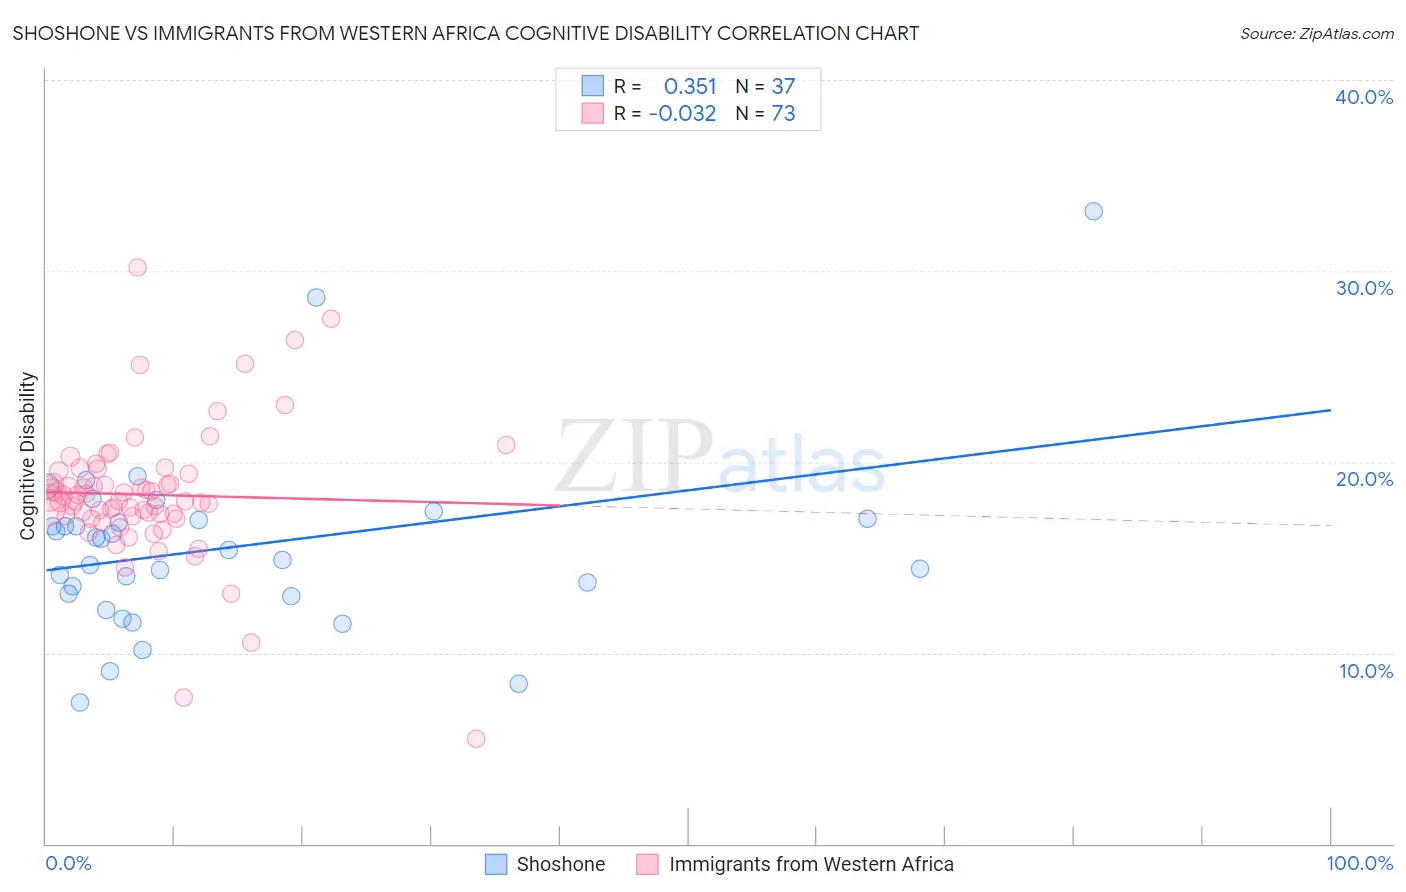
Shoshone vs Immigrants from Western Africa Cognitive Disability Correlation Chart
The statistical analysis conducted on geographies consisting of 66,619,814 people shows a mild positive correlation between the proportion of Shoshone and percentage of population with cognitive disability in the United States with a correlation coefficient (R) of 0.351 and weighted average of 17.3%. Similarly, the statistical analysis conducted on geographies consisting of 357,804,343 people shows no correlation between the proportion of Immigrants from Western Africa and percentage of population with cognitive disability in the United States with a correlation coefficient (R) of -0.032 and weighted average of 18.4%, a difference of 6.2%.
Cognitive Disability Correlation Summary
| Measurement | Shoshone | Immigrants from Western Africa |
| Minimum | 7.4% | 5.5% |
| Maximum | 33.1% | 30.2% |
| Range | 25.7% | 24.6% |
| Mean | 15.5% | 18.3% |
| Median | 15.4% | 17.9% |
| Interquartile 25% (IQ1) | 13.0% | 17.2% |
| Interquartile 75% (IQ3) | 17.0% | 19.5% |
| Interquartile Range (IQR) | 4.0% | 2.3% |
| Standard Deviation (Sample) | 4.8% | 3.6% |
| Standard Deviation (Population) | 4.7% | 3.6% |
Similar Demographics by Cognitive Disability
Demographics Similar to Shoshone by Cognitive Disability
In terms of cognitive disability, the demographic groups most similar to Shoshone are Ute (17.3%, a difference of 0.0%), Spanish (17.3%, a difference of 0.010%), Laotian (17.3%, a difference of 0.020%), Tsimshian (17.3%, a difference of 0.020%), and Sioux (17.3%, a difference of 0.020%).
| Demographics | Rating | Rank | Cognitive Disability |
| Immigrants | Portugal | 61.8 /100 | #169 | Good 17.2% |
| Ecuadorians | 59.6 /100 | #170 | Average 17.2% |
| Tlingit-Haida | 59.4 /100 | #171 | Average 17.2% |
| Immigrants | Turkey | 56.7 /100 | #172 | Average 17.2% |
| Immigrants | Northern Africa | 50.2 /100 | #173 | Average 17.3% |
| Laotians | 50.0 /100 | #174 | Average 17.3% |
| Tsimshian | 49.8 /100 | #175 | Average 17.3% |
| Shoshone | 49.2 /100 | #176 | Average 17.3% |
| Ute | 49.1 /100 | #177 | Average 17.3% |
| Spanish | 48.9 /100 | #178 | Average 17.3% |
| Sioux | 48.6 /100 | #179 | Average 17.3% |
| Pakistanis | 43.9 /100 | #180 | Average 17.3% |
| Immigrants | Guyana | 42.9 /100 | #181 | Average 17.3% |
| Arabs | 42.8 /100 | #182 | Average 17.3% |
| Spaniards | 40.3 /100 | #183 | Average 17.3% |
Demographics Similar to Immigrants from Western Africa by Cognitive Disability
In terms of cognitive disability, the demographic groups most similar to Immigrants from Western Africa are Immigrants from Eastern Africa (18.4%, a difference of 0.040%), Seminole (18.3%, a difference of 0.090%), Ugandan (18.3%, a difference of 0.090%), Colville (18.3%, a difference of 0.10%), and Immigrants from Eritrea (18.3%, a difference of 0.21%).
| Demographics | Rating | Rank | Cognitive Disability |
| Immigrants | Ghana | 0.0 /100 | #301 | Tragic 18.3% |
| Barbadians | 0.0 /100 | #302 | Tragic 18.3% |
| Immigrants | Kenya | 0.0 /100 | #303 | Tragic 18.3% |
| Immigrants | Eritrea | 0.0 /100 | #304 | Tragic 18.3% |
| Colville | 0.0 /100 | #305 | Tragic 18.3% |
| Seminole | 0.0 /100 | #306 | Tragic 18.3% |
| Ugandans | 0.0 /100 | #307 | Tragic 18.3% |
| Immigrants | Western Africa | 0.0 /100 | #308 | Tragic 18.4% |
| Immigrants | Eastern Africa | 0.0 /100 | #309 | Tragic 18.4% |
| Choctaw | 0.0 /100 | #310 | Tragic 18.4% |
| Hmong | 0.0 /100 | #311 | Tragic 18.4% |
| Chickasaw | 0.0 /100 | #312 | Tragic 18.5% |
| Yaqui | 0.0 /100 | #313 | Tragic 18.5% |
| Sub-Saharan Africans | 0.0 /100 | #314 | Tragic 18.5% |
| Immigrants | Dominica | 0.0 /100 | #315 | Tragic 18.6% |