Shoshone vs Slovak Cognitive Disability
COMPARE
Shoshone
Slovak
Cognitive Disability
Cognitive Disability Comparison
Shoshone
Slovaks
17.3%
COGNITIVE DISABILITY
49.2/ 100
METRIC RATING
176th/ 347
METRIC RANK
16.4%
COGNITIVE DISABILITY
99.9/ 100
METRIC RATING
35th/ 347
METRIC RANK
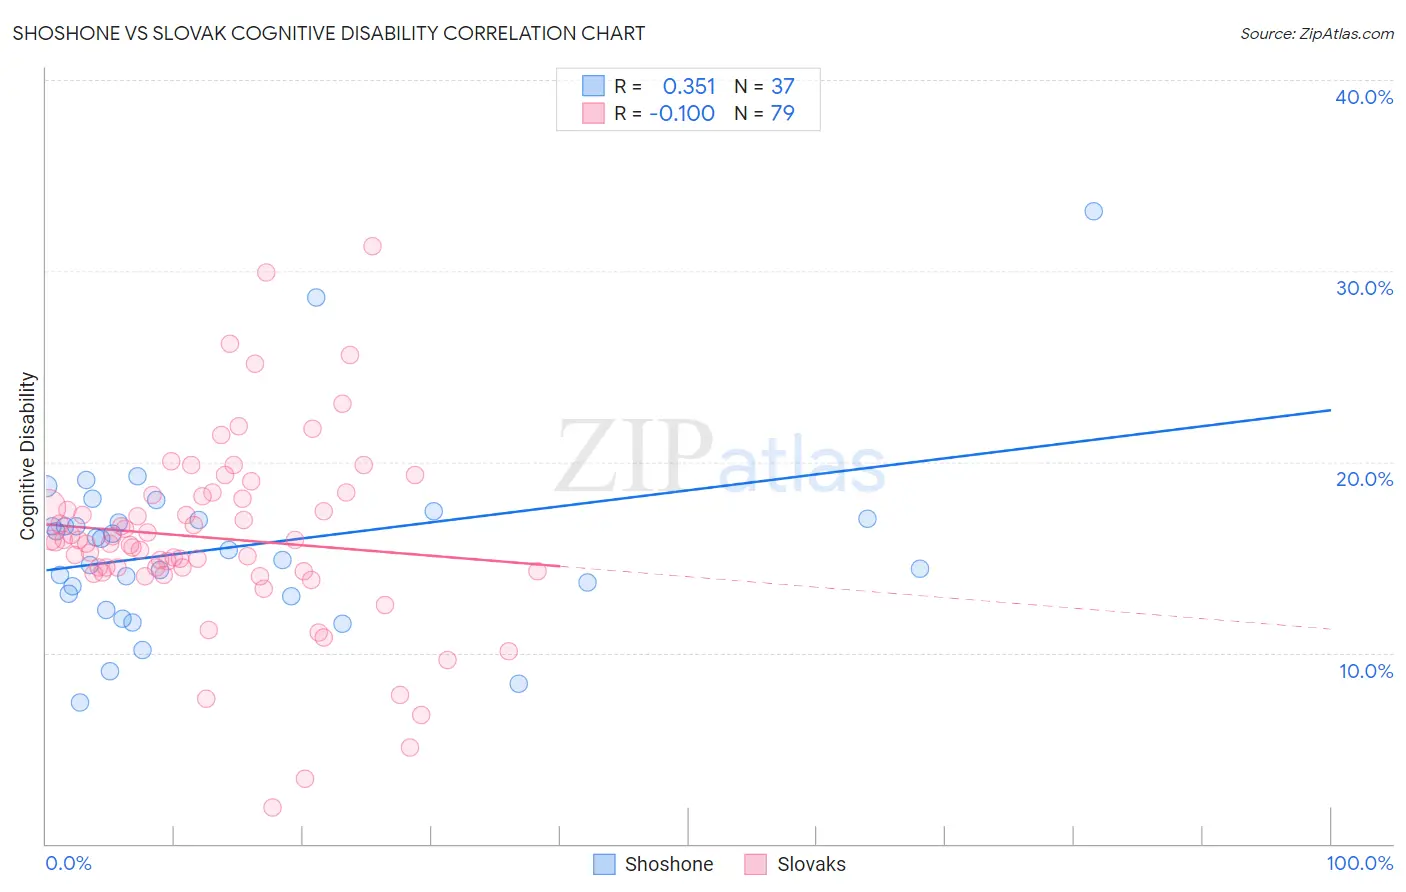
Shoshone vs Slovak Cognitive Disability Correlation Chart
The statistical analysis conducted on geographies consisting of 66,619,814 people shows a mild positive correlation between the proportion of Shoshone and percentage of population with cognitive disability in the United States with a correlation coefficient (R) of 0.351 and weighted average of 17.3%. Similarly, the statistical analysis conducted on geographies consisting of 397,859,059 people shows a slight negative correlation between the proportion of Slovaks and percentage of population with cognitive disability in the United States with a correlation coefficient (R) of -0.100 and weighted average of 16.4%, a difference of 5.2%.
Cognitive Disability Correlation Summary
| Measurement | Shoshone | Slovak |
| Minimum | 7.4% | 1.9% |
| Maximum | 33.1% | 31.3% |
| Range | 25.7% | 29.4% |
| Mean | 15.5% | 16.0% |
| Median | 15.4% | 15.8% |
| Interquartile 25% (IQ1) | 13.0% | 14.2% |
| Interquartile 75% (IQ3) | 17.0% | 18.2% |
| Interquartile Range (IQR) | 4.0% | 3.9% |
| Standard Deviation (Sample) | 4.8% | 4.9% |
| Standard Deviation (Population) | 4.7% | 4.9% |
Similar Demographics by Cognitive Disability
Demographics Similar to Shoshone by Cognitive Disability
In terms of cognitive disability, the demographic groups most similar to Shoshone are Ute (17.3%, a difference of 0.0%), Spanish (17.3%, a difference of 0.010%), Laotian (17.3%, a difference of 0.020%), Tsimshian (17.3%, a difference of 0.020%), and Sioux (17.3%, a difference of 0.020%).
| Demographics | Rating | Rank | Cognitive Disability |
| Immigrants | Portugal | 61.8 /100 | #169 | Good 17.2% |
| Ecuadorians | 59.6 /100 | #170 | Average 17.2% |
| Tlingit-Haida | 59.4 /100 | #171 | Average 17.2% |
| Immigrants | Turkey | 56.7 /100 | #172 | Average 17.2% |
| Immigrants | Northern Africa | 50.2 /100 | #173 | Average 17.3% |
| Laotians | 50.0 /100 | #174 | Average 17.3% |
| Tsimshian | 49.8 /100 | #175 | Average 17.3% |
| Shoshone | 49.2 /100 | #176 | Average 17.3% |
| Ute | 49.1 /100 | #177 | Average 17.3% |
| Spanish | 48.9 /100 | #178 | Average 17.3% |
| Sioux | 48.6 /100 | #179 | Average 17.3% |
| Pakistanis | 43.9 /100 | #180 | Average 17.3% |
| Immigrants | Guyana | 42.9 /100 | #181 | Average 17.3% |
| Arabs | 42.8 /100 | #182 | Average 17.3% |
| Spaniards | 40.3 /100 | #183 | Average 17.3% |
Demographics Similar to Slovaks by Cognitive Disability
In terms of cognitive disability, the demographic groups most similar to Slovaks are Greek (16.4%, a difference of 0.010%), Italian (16.4%, a difference of 0.080%), Russian (16.4%, a difference of 0.080%), Slovene (16.5%, a difference of 0.15%), and Immigrants from Israel (16.4%, a difference of 0.16%).
| Demographics | Rating | Rank | Cognitive Disability |
| Poles | 99.9 /100 | #28 | Exceptional 16.4% |
| Filipinos | 99.9 /100 | #29 | Exceptional 16.4% |
| Czechs | 99.9 /100 | #30 | Exceptional 16.4% |
| Immigrants | Romania | 99.9 /100 | #31 | Exceptional 16.4% |
| Immigrants | Israel | 99.9 /100 | #32 | Exceptional 16.4% |
| Italians | 99.9 /100 | #33 | Exceptional 16.4% |
| Russians | 99.9 /100 | #34 | Exceptional 16.4% |
| Slovaks | 99.9 /100 | #35 | Exceptional 16.4% |
| Greeks | 99.9 /100 | #36 | Exceptional 16.4% |
| Slovenes | 99.9 /100 | #37 | Exceptional 16.5% |
| Immigrants | Eastern Europe | 99.9 /100 | #38 | Exceptional 16.5% |
| Bolivians | 99.9 /100 | #39 | Exceptional 16.5% |
| Immigrants | Belarus | 99.9 /100 | #40 | Exceptional 16.5% |
| Cubans | 99.9 /100 | #41 | Exceptional 16.5% |
| Hungarians | 99.9 /100 | #42 | Exceptional 16.5% |