Shoshone vs Salvadoran Cognitive Disability
COMPARE
Shoshone
Salvadoran
Cognitive Disability
Cognitive Disability Comparison
Shoshone
Salvadorans
17.3%
COGNITIVE DISABILITY
49.2/ 100
METRIC RATING
176th/ 347
METRIC RANK
17.6%
COGNITIVE DISABILITY
6.7/ 100
METRIC RATING
217th/ 347
METRIC RANK
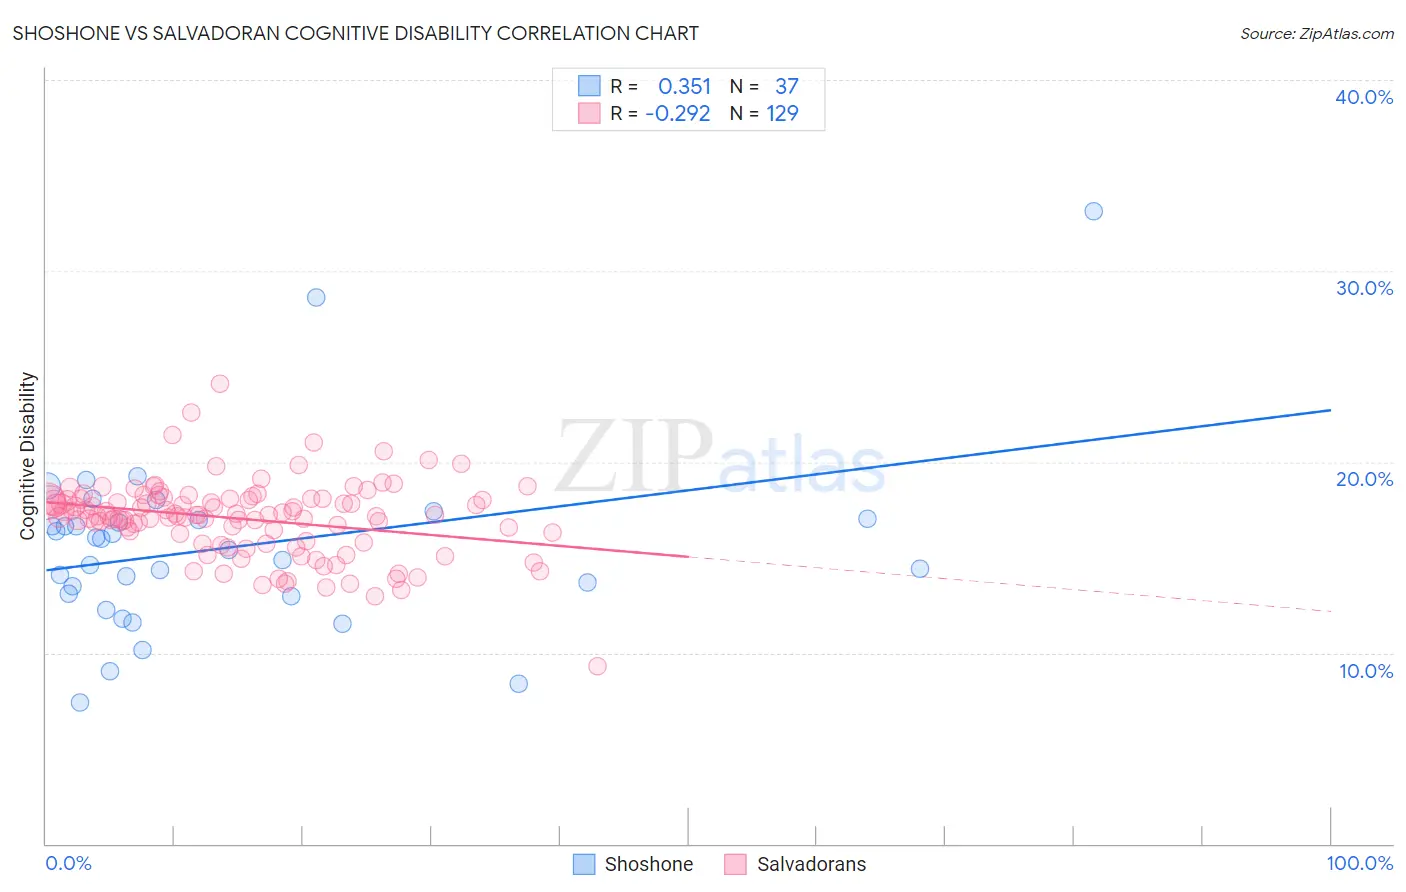
Shoshone vs Salvadoran Cognitive Disability Correlation Chart
The statistical analysis conducted on geographies consisting of 66,619,814 people shows a mild positive correlation between the proportion of Shoshone and percentage of population with cognitive disability in the United States with a correlation coefficient (R) of 0.351 and weighted average of 17.3%. Similarly, the statistical analysis conducted on geographies consisting of 398,952,602 people shows a weak negative correlation between the proportion of Salvadorans and percentage of population with cognitive disability in the United States with a correlation coefficient (R) of -0.292 and weighted average of 17.6%, a difference of 1.8%.
Cognitive Disability Correlation Summary
| Measurement | Shoshone | Salvadoran |
| Minimum | 7.4% | 9.3% |
| Maximum | 33.1% | 24.1% |
| Range | 25.7% | 14.8% |
| Mean | 15.5% | 17.0% |
| Median | 15.4% | 17.2% |
| Interquartile 25% (IQ1) | 13.0% | 16.0% |
| Interquartile 75% (IQ3) | 17.0% | 18.0% |
| Interquartile Range (IQR) | 4.0% | 2.0% |
| Standard Deviation (Sample) | 4.8% | 2.0% |
| Standard Deviation (Population) | 4.7% | 2.0% |
Similar Demographics by Cognitive Disability
Demographics Similar to Shoshone by Cognitive Disability
In terms of cognitive disability, the demographic groups most similar to Shoshone are Ute (17.3%, a difference of 0.0%), Spanish (17.3%, a difference of 0.010%), Laotian (17.3%, a difference of 0.020%), Tsimshian (17.3%, a difference of 0.020%), and Sioux (17.3%, a difference of 0.020%).
| Demographics | Rating | Rank | Cognitive Disability |
| Immigrants | Portugal | 61.8 /100 | #169 | Good 17.2% |
| Ecuadorians | 59.6 /100 | #170 | Average 17.2% |
| Tlingit-Haida | 59.4 /100 | #171 | Average 17.2% |
| Immigrants | Turkey | 56.7 /100 | #172 | Average 17.2% |
| Immigrants | Northern Africa | 50.2 /100 | #173 | Average 17.3% |
| Laotians | 50.0 /100 | #174 | Average 17.3% |
| Tsimshian | 49.8 /100 | #175 | Average 17.3% |
| Shoshone | 49.2 /100 | #176 | Average 17.3% |
| Ute | 49.1 /100 | #177 | Average 17.3% |
| Spanish | 48.9 /100 | #178 | Average 17.3% |
| Sioux | 48.6 /100 | #179 | Average 17.3% |
| Pakistanis | 43.9 /100 | #180 | Average 17.3% |
| Immigrants | Guyana | 42.9 /100 | #181 | Average 17.3% |
| Arabs | 42.8 /100 | #182 | Average 17.3% |
| Spaniards | 40.3 /100 | #183 | Average 17.3% |
Demographics Similar to Salvadorans by Cognitive Disability
In terms of cognitive disability, the demographic groups most similar to Salvadorans are Alaskan Athabascan (17.6%, a difference of 0.020%), Okinawan (17.6%, a difference of 0.020%), Immigrants from El Salvador (17.6%, a difference of 0.030%), Icelander (17.6%, a difference of 0.030%), and Immigrants from Sierra Leone (17.6%, a difference of 0.040%).
| Demographics | Rating | Rank | Cognitive Disability |
| Immigrants | Jamaica | 8.5 /100 | #210 | Tragic 17.6% |
| Taiwanese | 7.7 /100 | #211 | Tragic 17.6% |
| Immigrants | Oceania | 7.3 /100 | #212 | Tragic 17.6% |
| Hawaiians | 7.2 /100 | #213 | Tragic 17.6% |
| Immigrants | El Salvador | 7.0 /100 | #214 | Tragic 17.6% |
| Alaskan Athabascans | 6.9 /100 | #215 | Tragic 17.6% |
| Okinawans | 6.8 /100 | #216 | Tragic 17.6% |
| Salvadorans | 6.7 /100 | #217 | Tragic 17.6% |
| Icelanders | 6.4 /100 | #218 | Tragic 17.6% |
| Immigrants | Sierra Leone | 6.3 /100 | #219 | Tragic 17.6% |
| Zimbabweans | 6.1 /100 | #220 | Tragic 17.6% |
| Moroccans | 5.9 /100 | #221 | Tragic 17.6% |
| Central Americans | 4.5 /100 | #222 | Tragic 17.7% |
| Alsatians | 4.5 /100 | #223 | Tragic 17.7% |
| Fijians | 3.4 /100 | #224 | Tragic 17.7% |