Shoshone vs Sri Lankan Cognitive Disability
COMPARE
Shoshone
Sri Lankan
Cognitive Disability
Cognitive Disability Comparison
Shoshone
Sri Lankans
17.3%
COGNITIVE DISABILITY
49.2/ 100
METRIC RATING
176th/ 347
METRIC RANK
17.1%
COGNITIVE DISABILITY
78.9/ 100
METRIC RATING
156th/ 347
METRIC RANK
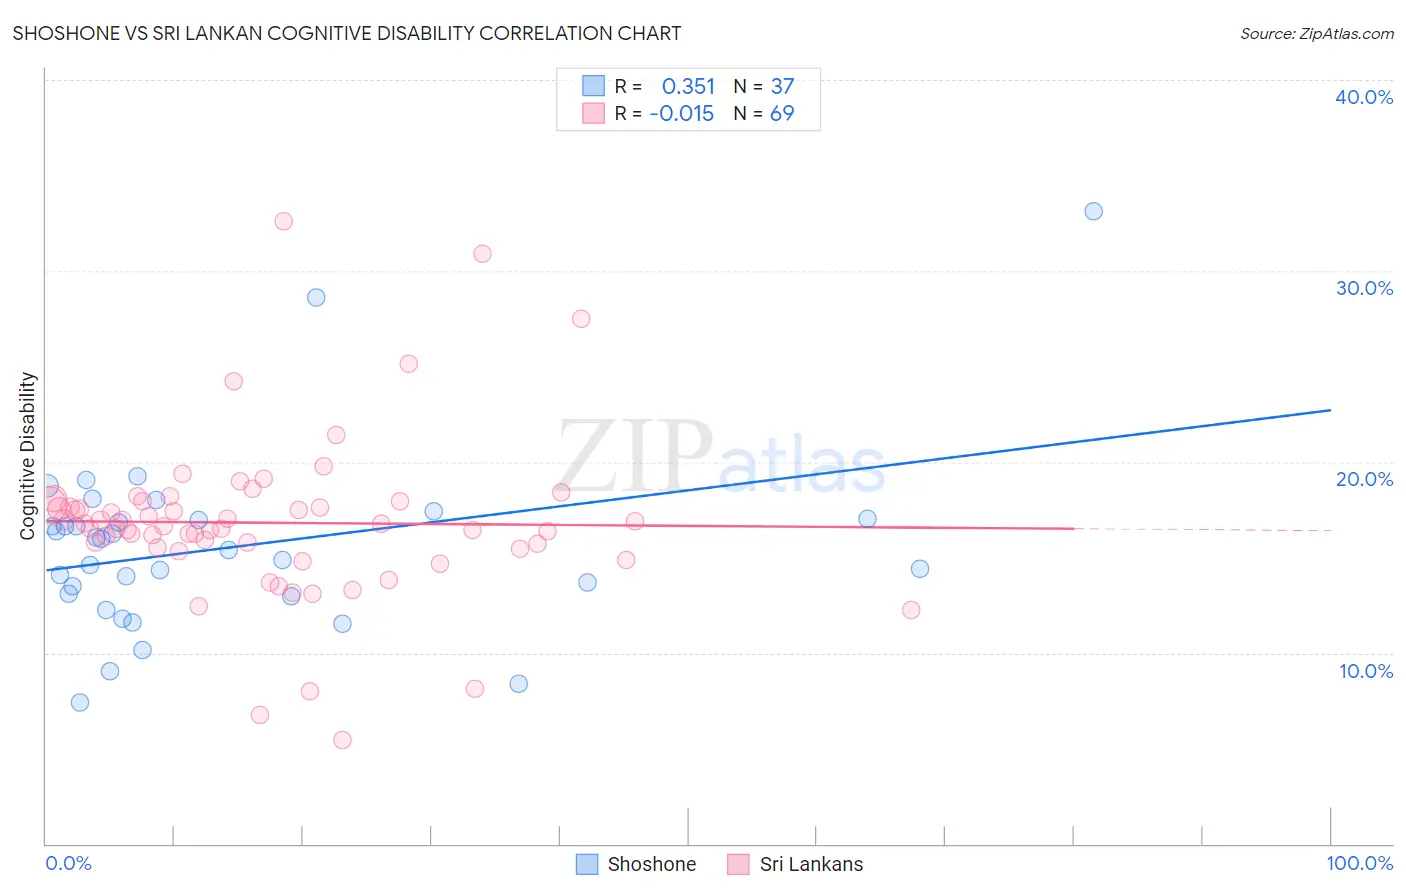
Shoshone vs Sri Lankan Cognitive Disability Correlation Chart
The statistical analysis conducted on geographies consisting of 66,619,814 people shows a mild positive correlation between the proportion of Shoshone and percentage of population with cognitive disability in the United States with a correlation coefficient (R) of 0.351 and weighted average of 17.3%. Similarly, the statistical analysis conducted on geographies consisting of 440,507,273 people shows no correlation between the proportion of Sri Lankans and percentage of population with cognitive disability in the United States with a correlation coefficient (R) of -0.015 and weighted average of 17.1%, a difference of 0.97%.
Cognitive Disability Correlation Summary
| Measurement | Shoshone | Sri Lankan |
| Minimum | 7.4% | 5.5% |
| Maximum | 33.1% | 32.6% |
| Range | 25.7% | 27.2% |
| Mean | 15.5% | 16.8% |
| Median | 15.4% | 16.6% |
| Interquartile 25% (IQ1) | 13.0% | 15.5% |
| Interquartile 75% (IQ3) | 17.0% | 17.8% |
| Interquartile Range (IQR) | 4.0% | 2.4% |
| Standard Deviation (Sample) | 4.8% | 4.3% |
| Standard Deviation (Population) | 4.7% | 4.3% |
Demographics Similar to Shoshone and Sri Lankans by Cognitive Disability
In terms of cognitive disability, the demographic groups most similar to Shoshone are Laotian (17.3%, a difference of 0.020%), Tsimshian (17.3%, a difference of 0.020%), Immigrants from Northern Africa (17.3%, a difference of 0.030%), Immigrants from Turkey (17.2%, a difference of 0.21%), and Ecuadorian (17.2%, a difference of 0.30%). Similarly, the demographic groups most similar to Sri Lankans are Immigrants from Australia (17.1%, a difference of 0.12%), Celtic (17.1%, a difference of 0.19%), Immigrants from Latvia (17.2%, a difference of 0.22%), Australian (17.2%, a difference of 0.25%), and American (17.2%, a difference of 0.26%).
| Demographics | Rating | Rank | Cognitive Disability |
| Sri Lankans | 78.9 /100 | #156 | Good 17.1% |
| Immigrants | Australia | 76.0 /100 | #157 | Good 17.1% |
| Celtics | 74.1 /100 | #158 | Good 17.1% |
| Immigrants | Latvia | 73.2 /100 | #159 | Good 17.2% |
| Australians | 72.4 /100 | #160 | Good 17.2% |
| Americans | 72.2 /100 | #161 | Good 17.2% |
| Yugoslavians | 71.6 /100 | #162 | Good 17.2% |
| Immigrants | Switzerland | 71.5 /100 | #163 | Good 17.2% |
| Armenians | 70.1 /100 | #164 | Good 17.2% |
| Immigrants | Albania | 64.9 /100 | #165 | Good 17.2% |
| Immigrants | Ecuador | 64.4 /100 | #166 | Good 17.2% |
| Immigrants | Syria | 63.5 /100 | #167 | Good 17.2% |
| Immigrants | Immigrants | 62.5 /100 | #168 | Good 17.2% |
| Immigrants | Portugal | 61.8 /100 | #169 | Good 17.2% |
| Ecuadorians | 59.6 /100 | #170 | Average 17.2% |
| Tlingit-Haida | 59.4 /100 | #171 | Average 17.2% |
| Immigrants | Turkey | 56.7 /100 | #172 | Average 17.2% |
| Immigrants | Northern Africa | 50.2 /100 | #173 | Average 17.3% |
| Laotians | 50.0 /100 | #174 | Average 17.3% |
| Tsimshian | 49.8 /100 | #175 | Average 17.3% |
| Shoshone | 49.2 /100 | #176 | Average 17.3% |