Serbian vs Nigerian 7th Grade
COMPARE
Serbian
Nigerian
7th Grade
7th Grade Comparison
Serbians
Nigerians
97.0%
7TH GRADE
99.8/ 100
METRIC RATING
56th/ 347
METRIC RANK
95.5%
7TH GRADE
3.0/ 100
METRIC RATING
234th/ 347
METRIC RANK
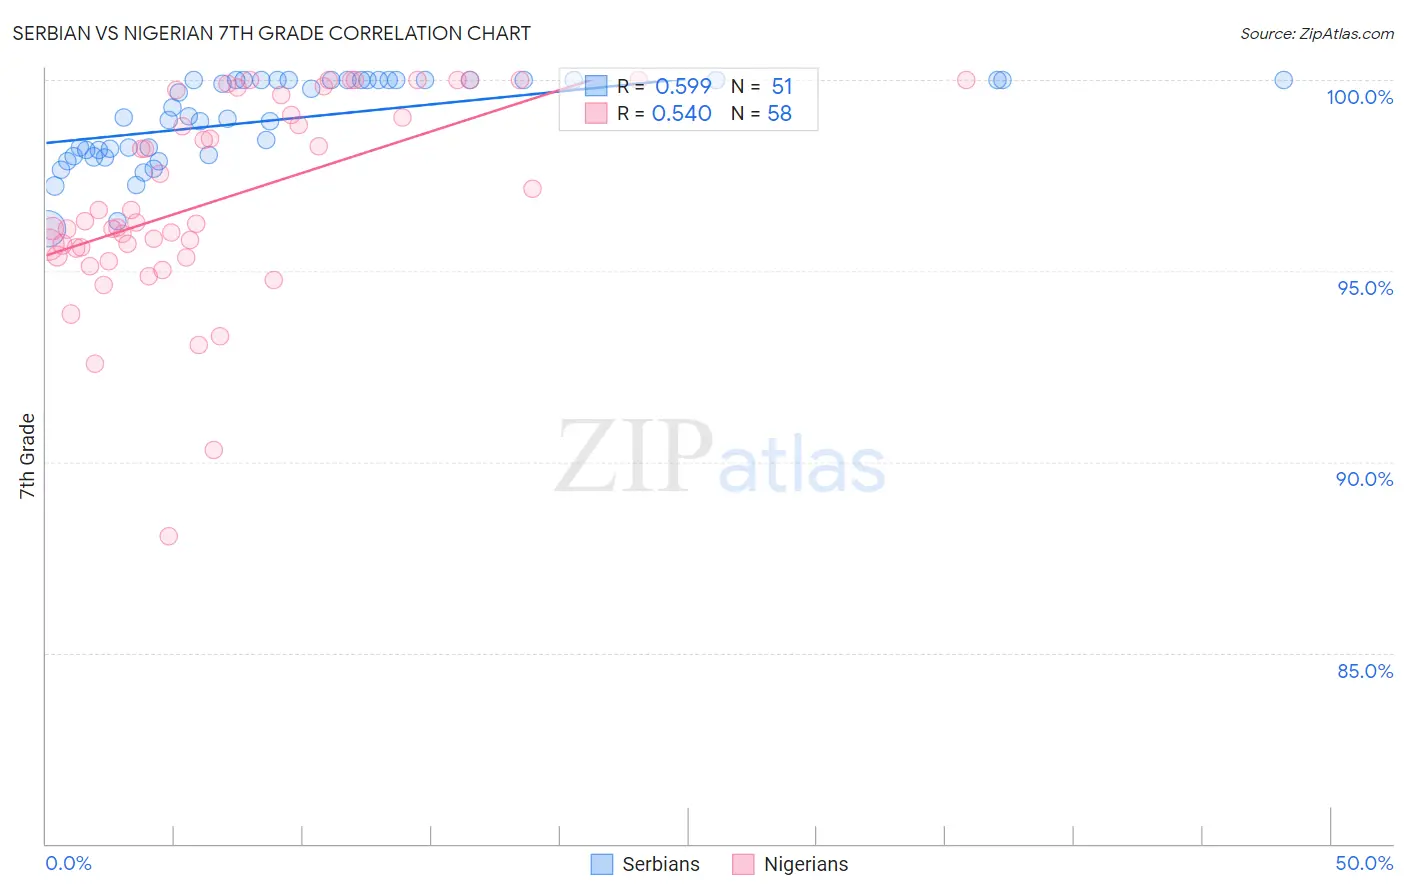
Serbian vs Nigerian 7th Grade Correlation Chart
The statistical analysis conducted on geographies consisting of 267,642,942 people shows a substantial positive correlation between the proportion of Serbians and percentage of population with at least 7th grade education in the United States with a correlation coefficient (R) of 0.599 and weighted average of 97.0%. Similarly, the statistical analysis conducted on geographies consisting of 332,724,627 people shows a substantial positive correlation between the proportion of Nigerians and percentage of population with at least 7th grade education in the United States with a correlation coefficient (R) of 0.540 and weighted average of 95.5%, a difference of 1.5%.
7th Grade Correlation Summary
| Measurement | Serbian | Nigerian |
| Minimum | 96.1% | 88.0% |
| Maximum | 100.0% | 100.0% |
| Range | 3.9% | 12.0% |
| Mean | 99.0% | 96.9% |
| Median | 99.1% | 96.3% |
| Interquartile 25% (IQ1) | 98.0% | 95.6% |
| Interquartile 75% (IQ3) | 100.0% | 99.6% |
| Interquartile Range (IQR) | 2.0% | 4.0% |
| Standard Deviation (Sample) | 1.1% | 2.6% |
| Standard Deviation (Population) | 1.1% | 2.6% |
Similar Demographics by 7th Grade
Demographics Similar to Serbians by 7th Grade
In terms of 7th grade, the demographic groups most similar to Serbians are Russian (97.0%, a difference of 0.0%), American (97.0%, a difference of 0.0%), Australian (97.0%, a difference of 0.010%), White/Caucasian (97.0%, a difference of 0.020%), and Macedonian (97.0%, a difference of 0.020%).
| Demographics | Rating | Rank | 7th Grade |
| Slavs | 99.9 /100 | #49 | Exceptional 97.1% |
| Immigrants | Scotland | 99.9 /100 | #50 | Exceptional 97.1% |
| Estonians | 99.9 /100 | #51 | Exceptional 97.0% |
| Greeks | 99.9 /100 | #52 | Exceptional 97.0% |
| Austrians | 99.8 /100 | #53 | Exceptional 97.0% |
| Australians | 99.8 /100 | #54 | Exceptional 97.0% |
| Russians | 99.8 /100 | #55 | Exceptional 97.0% |
| Serbians | 99.8 /100 | #56 | Exceptional 97.0% |
| Americans | 99.8 /100 | #57 | Exceptional 97.0% |
| Whites/Caucasians | 99.8 /100 | #58 | Exceptional 97.0% |
| Macedonians | 99.8 /100 | #59 | Exceptional 97.0% |
| Immigrants | Canada | 99.8 /100 | #60 | Exceptional 96.9% |
| Creek | 99.8 /100 | #61 | Exceptional 96.9% |
| Immigrants | North America | 99.8 /100 | #62 | Exceptional 96.9% |
| Immigrants | Northern Europe | 99.7 /100 | #63 | Exceptional 96.9% |
Demographics Similar to Nigerians by 7th Grade
In terms of 7th grade, the demographic groups most similar to Nigerians are Immigrants from Africa (95.5%, a difference of 0.010%), Costa Rican (95.5%, a difference of 0.020%), Immigrants from Indonesia (95.5%, a difference of 0.020%), Asian (95.5%, a difference of 0.020%), and Immigrants from Asia (95.5%, a difference of 0.040%).
| Demographics | Rating | Rank | 7th Grade |
| Immigrants | Western Asia | 5.4 /100 | #227 | Tragic 95.6% |
| Immigrants | Eastern Africa | 5.1 /100 | #228 | Tragic 95.6% |
| Immigrants | Panama | 4.9 /100 | #229 | Tragic 95.6% |
| Natives/Alaskans | 4.2 /100 | #230 | Tragic 95.6% |
| Senegalese | 4.0 /100 | #231 | Tragic 95.6% |
| Costa Ricans | 3.3 /100 | #232 | Tragic 95.5% |
| Immigrants | Indonesia | 3.3 /100 | #233 | Tragic 95.5% |
| Nigerians | 3.0 /100 | #234 | Tragic 95.5% |
| Immigrants | Africa | 2.7 /100 | #235 | Tragic 95.5% |
| Asians | 2.6 /100 | #236 | Tragic 95.5% |
| Immigrants | Asia | 2.3 /100 | #237 | Tragic 95.5% |
| Indians (Asian) | 2.3 /100 | #238 | Tragic 95.5% |
| Jamaicans | 2.2 /100 | #239 | Tragic 95.5% |
| Immigrants | Sierra Leone | 2.0 /100 | #240 | Tragic 95.5% |
| South American Indians | 2.0 /100 | #241 | Tragic 95.5% |