Senegalese vs Israeli Male Disability
COMPARE
Senegalese
Israeli
Male Disability
Male Disability Comparison
Senegalese
Israelis
11.4%
MALE DISABILITY
23.2/ 100
METRIC RATING
191st/ 347
METRIC RANK
10.3%
MALE DISABILITY
99.7/ 100
METRIC RATING
48th/ 347
METRIC RANK
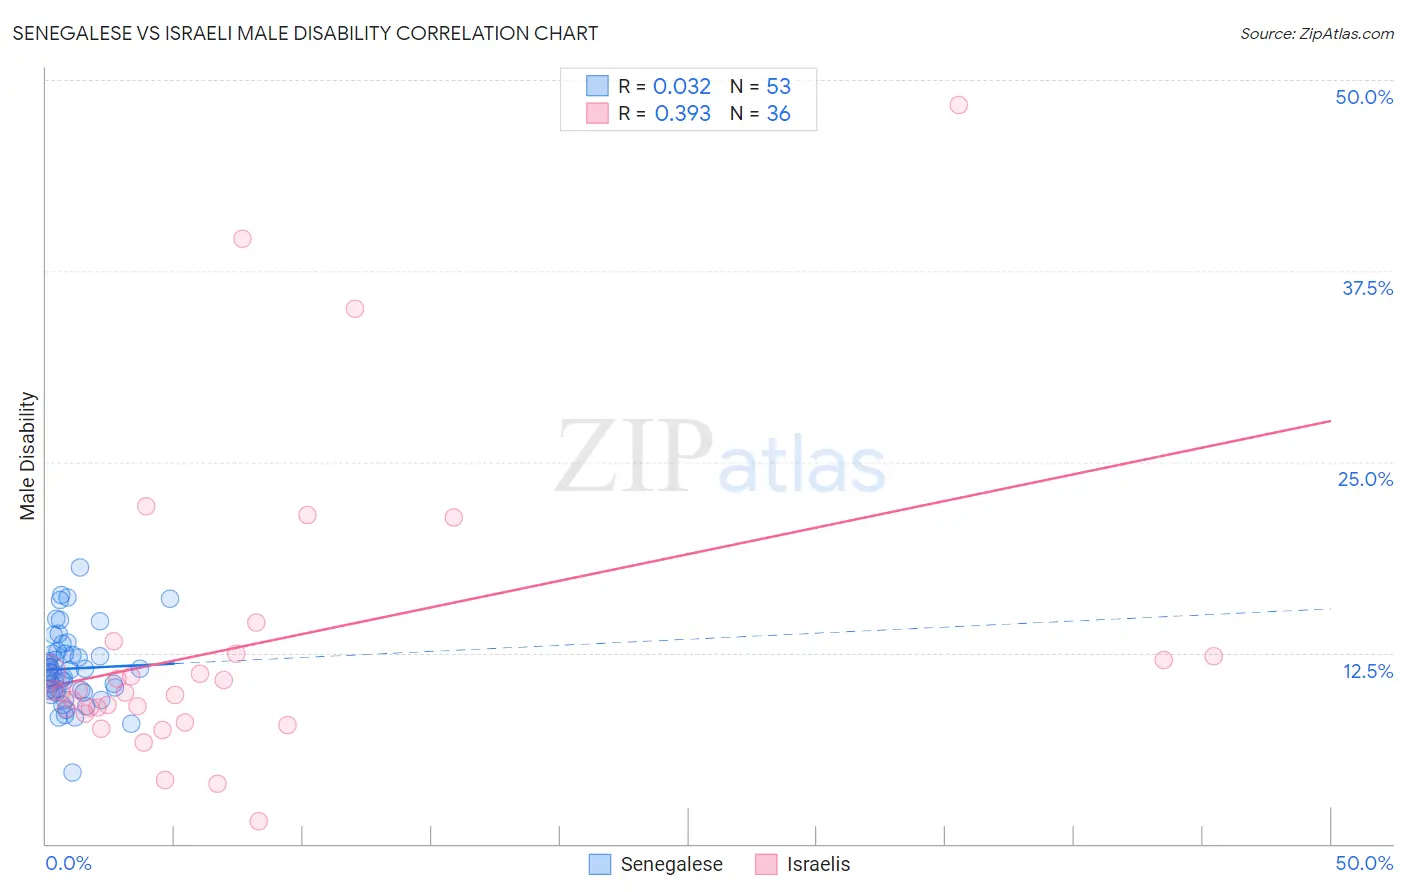
Senegalese vs Israeli Male Disability Correlation Chart
The statistical analysis conducted on geographies consisting of 78,137,196 people shows no correlation between the proportion of Senegalese and percentage of males with a disability in the United States with a correlation coefficient (R) of 0.032 and weighted average of 11.4%. Similarly, the statistical analysis conducted on geographies consisting of 211,170,801 people shows a mild positive correlation between the proportion of Israelis and percentage of males with a disability in the United States with a correlation coefficient (R) of 0.393 and weighted average of 10.3%, a difference of 10.5%.
Male Disability Correlation Summary
| Measurement | Senegalese | Israeli |
| Minimum | 4.6% | 1.5% |
| Maximum | 18.0% | 48.4% |
| Range | 13.4% | 46.9% |
| Mean | 11.5% | 13.0% |
| Median | 11.2% | 10.0% |
| Interquartile 25% (IQ1) | 10.0% | 8.7% |
| Interquartile 75% (IQ3) | 12.5% | 12.4% |
| Interquartile Range (IQR) | 2.5% | 3.7% |
| Standard Deviation (Sample) | 2.5% | 9.7% |
| Standard Deviation (Population) | 2.5% | 9.6% |
Similar Demographics by Male Disability
Demographics Similar to Senegalese by Male Disability
In terms of male disability, the demographic groups most similar to Senegalese are Assyrian/Chaldean/Syriac (11.4%, a difference of 0.0%), Greek (11.4%, a difference of 0.080%), Immigrants from Bosnia and Herzegovina (11.4%, a difference of 0.16%), Belizean (11.4%, a difference of 0.16%), and Immigrants from Oceania (11.4%, a difference of 0.19%).
| Demographics | Rating | Rank | Male Disability |
| Iraqis | 30.5 /100 | #184 | Fair 11.3% |
| Pakistanis | 30.3 /100 | #185 | Fair 11.3% |
| Immigrants | Zaire | 27.6 /100 | #186 | Fair 11.4% |
| Immigrants | Austria | 27.3 /100 | #187 | Fair 11.4% |
| Estonians | 26.8 /100 | #188 | Fair 11.4% |
| Immigrants | Netherlands | 25.9 /100 | #189 | Fair 11.4% |
| Immigrants | Bosnia and Herzegovina | 25.4 /100 | #190 | Fair 11.4% |
| Senegalese | 23.2 /100 | #191 | Fair 11.4% |
| Assyrians/Chaldeans/Syriacs | 23.2 /100 | #192 | Fair 11.4% |
| Greeks | 22.2 /100 | #193 | Fair 11.4% |
| Belizeans | 21.2 /100 | #194 | Fair 11.4% |
| Immigrants | Oceania | 20.9 /100 | #195 | Fair 11.4% |
| West Indians | 18.4 /100 | #196 | Poor 11.4% |
| Somalis | 18.2 /100 | #197 | Poor 11.4% |
| Immigrants | Jamaica | 16.3 /100 | #198 | Poor 11.5% |
Demographics Similar to Israelis by Male Disability
In terms of male disability, the demographic groups most similar to Israelis are Immigrants from Peru (10.3%, a difference of 0.030%), Immigrants from Spain (10.3%, a difference of 0.060%), Cambodian (10.3%, a difference of 0.070%), Immigrants from El Salvador (10.3%, a difference of 0.15%), and Turkish (10.3%, a difference of 0.15%).
| Demographics | Rating | Rank | Male Disability |
| Taiwanese | 99.8 /100 | #41 | Exceptional 10.3% |
| Mongolians | 99.7 /100 | #42 | Exceptional 10.3% |
| Immigrants | Bangladesh | 99.7 /100 | #43 | Exceptional 10.3% |
| Immigrants | El Salvador | 99.7 /100 | #44 | Exceptional 10.3% |
| Turks | 99.7 /100 | #45 | Exceptional 10.3% |
| Cambodians | 99.7 /100 | #46 | Exceptional 10.3% |
| Immigrants | Peru | 99.7 /100 | #47 | Exceptional 10.3% |
| Israelis | 99.7 /100 | #48 | Exceptional 10.3% |
| Immigrants | Spain | 99.7 /100 | #49 | Exceptional 10.3% |
| South Americans | 99.6 /100 | #50 | Exceptional 10.3% |
| Salvadorans | 99.6 /100 | #51 | Exceptional 10.4% |
| Immigrants | Saudi Arabia | 99.6 /100 | #52 | Exceptional 10.4% |
| Immigrants | Uzbekistan | 99.6 /100 | #53 | Exceptional 10.4% |
| Peruvians | 99.6 /100 | #54 | Exceptional 10.4% |
| Immigrants | Eritrea | 99.6 /100 | #55 | Exceptional 10.4% |