Senegalese vs Immigrants from Panama Cognitive Disability
COMPARE
Senegalese
Immigrants from Panama
Cognitive Disability
Cognitive Disability Comparison
Senegalese
Immigrants from Panama
19.0%
COGNITIVE DISABILITY
0.0/ 100
METRIC RATING
335th/ 347
METRIC RANK
17.5%
COGNITIVE DISABILITY
14.8/ 100
METRIC RATING
198th/ 347
METRIC RANK
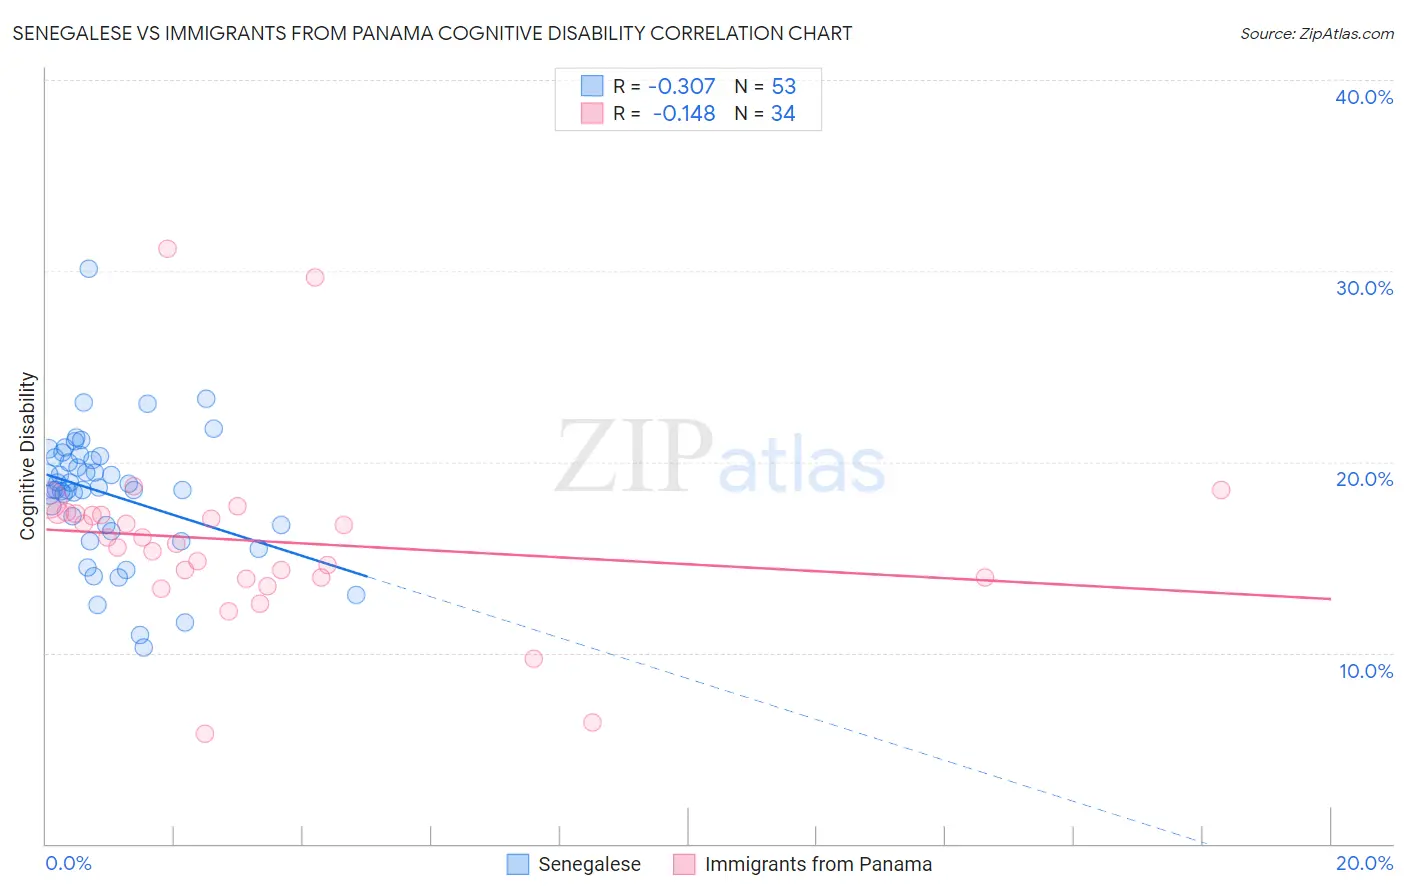
Senegalese vs Immigrants from Panama Cognitive Disability Correlation Chart
The statistical analysis conducted on geographies consisting of 78,141,567 people shows a mild negative correlation between the proportion of Senegalese and percentage of population with cognitive disability in the United States with a correlation coefficient (R) of -0.307 and weighted average of 19.0%. Similarly, the statistical analysis conducted on geographies consisting of 221,178,303 people shows a poor negative correlation between the proportion of Immigrants from Panama and percentage of population with cognitive disability in the United States with a correlation coefficient (R) of -0.148 and weighted average of 17.5%, a difference of 8.5%.
Cognitive Disability Correlation Summary
| Measurement | Senegalese | Immigrants from Panama |
| Minimum | 10.3% | 5.8% |
| Maximum | 30.1% | 31.2% |
| Range | 19.8% | 25.4% |
| Mean | 18.3% | 15.9% |
| Median | 18.6% | 15.9% |
| Interquartile 25% (IQ1) | 16.5% | 13.9% |
| Interquartile 75% (IQ3) | 20.3% | 17.3% |
| Interquartile Range (IQR) | 3.8% | 3.3% |
| Standard Deviation (Sample) | 3.4% | 4.8% |
| Standard Deviation (Population) | 3.4% | 4.7% |
Similar Demographics by Cognitive Disability
Demographics Similar to Senegalese by Cognitive Disability
In terms of cognitive disability, the demographic groups most similar to Senegalese are Black/African American (19.0%, a difference of 0.29%), Immigrants from Saudi Arabia (19.1%, a difference of 0.42%), Sudanese (18.9%, a difference of 0.54%), Lumbee (19.1%, a difference of 0.77%), and Immigrants from Yemen (18.8%, a difference of 0.93%).
| Demographics | Rating | Rank | Cognitive Disability |
| Kiowa | 0.0 /100 | #328 | Tragic 18.7% |
| Navajo | 0.0 /100 | #329 | Tragic 18.8% |
| Immigrants | Dominican Republic | 0.0 /100 | #330 | Tragic 18.8% |
| Pima | 0.0 /100 | #331 | Tragic 18.8% |
| Immigrants | Sudan | 0.0 /100 | #332 | Tragic 18.8% |
| Immigrants | Yemen | 0.0 /100 | #333 | Tragic 18.8% |
| Sudanese | 0.0 /100 | #334 | Tragic 18.9% |
| Senegalese | 0.0 /100 | #335 | Tragic 19.0% |
| Blacks/African Americans | 0.0 /100 | #336 | Tragic 19.0% |
| Immigrants | Saudi Arabia | 0.0 /100 | #337 | Tragic 19.1% |
| Lumbee | 0.0 /100 | #338 | Tragic 19.1% |
| Puerto Ricans | 0.0 /100 | #339 | Tragic 19.2% |
| Cape Verdeans | 0.0 /100 | #340 | Tragic 19.2% |
| Tohono O'odham | 0.0 /100 | #341 | Tragic 19.3% |
| Houma | 0.0 /100 | #342 | Tragic 19.3% |
Demographics Similar to Immigrants from Panama by Cognitive Disability
In terms of cognitive disability, the demographic groups most similar to Immigrants from Panama are Immigrants from Singapore (17.5%, a difference of 0.030%), Haitian (17.5%, a difference of 0.040%), Immigrants from Afghanistan (17.5%, a difference of 0.10%), South American Indian (17.5%, a difference of 0.11%), and Guyanese (17.5%, a difference of 0.14%).
| Demographics | Rating | Rank | Cognitive Disability |
| Immigrants | Nonimmigrants | 27.4 /100 | #191 | Fair 17.4% |
| Immigrants | Haiti | 27.1 /100 | #192 | Fair 17.4% |
| Delaware | 25.6 /100 | #193 | Fair 17.4% |
| Immigrants | Bosnia and Herzegovina | 22.0 /100 | #194 | Fair 17.4% |
| New Zealanders | 21.1 /100 | #195 | Fair 17.4% |
| Guyanese | 17.5 /100 | #196 | Poor 17.5% |
| Immigrants | Afghanistan | 16.7 /100 | #197 | Poor 17.5% |
| Immigrants | Panama | 14.8 /100 | #198 | Poor 17.5% |
| Immigrants | Singapore | 14.3 /100 | #199 | Poor 17.5% |
| Haitians | 14.1 /100 | #200 | Poor 17.5% |
| South American Indians | 13.0 /100 | #201 | Poor 17.5% |
| Immigrants | Morocco | 12.0 /100 | #202 | Poor 17.5% |
| Immigrants | Caribbean | 11.0 /100 | #203 | Poor 17.5% |
| Immigrants | Zimbabwe | 11.0 /100 | #204 | Poor 17.5% |
| Puget Sound Salish | 10.9 /100 | #205 | Poor 17.5% |