Senegalese vs Immigrants from Dominican Republic 10th Grade
COMPARE
Senegalese
Immigrants from Dominican Republic
10th Grade
10th Grade Comparison
Senegalese
Immigrants from Dominican Republic
93.0%
10TH GRADE
2.4/ 100
METRIC RATING
243rd/ 347
METRIC RANK
88.7%
10TH GRADE
0.0/ 100
METRIC RATING
335th/ 347
METRIC RANK
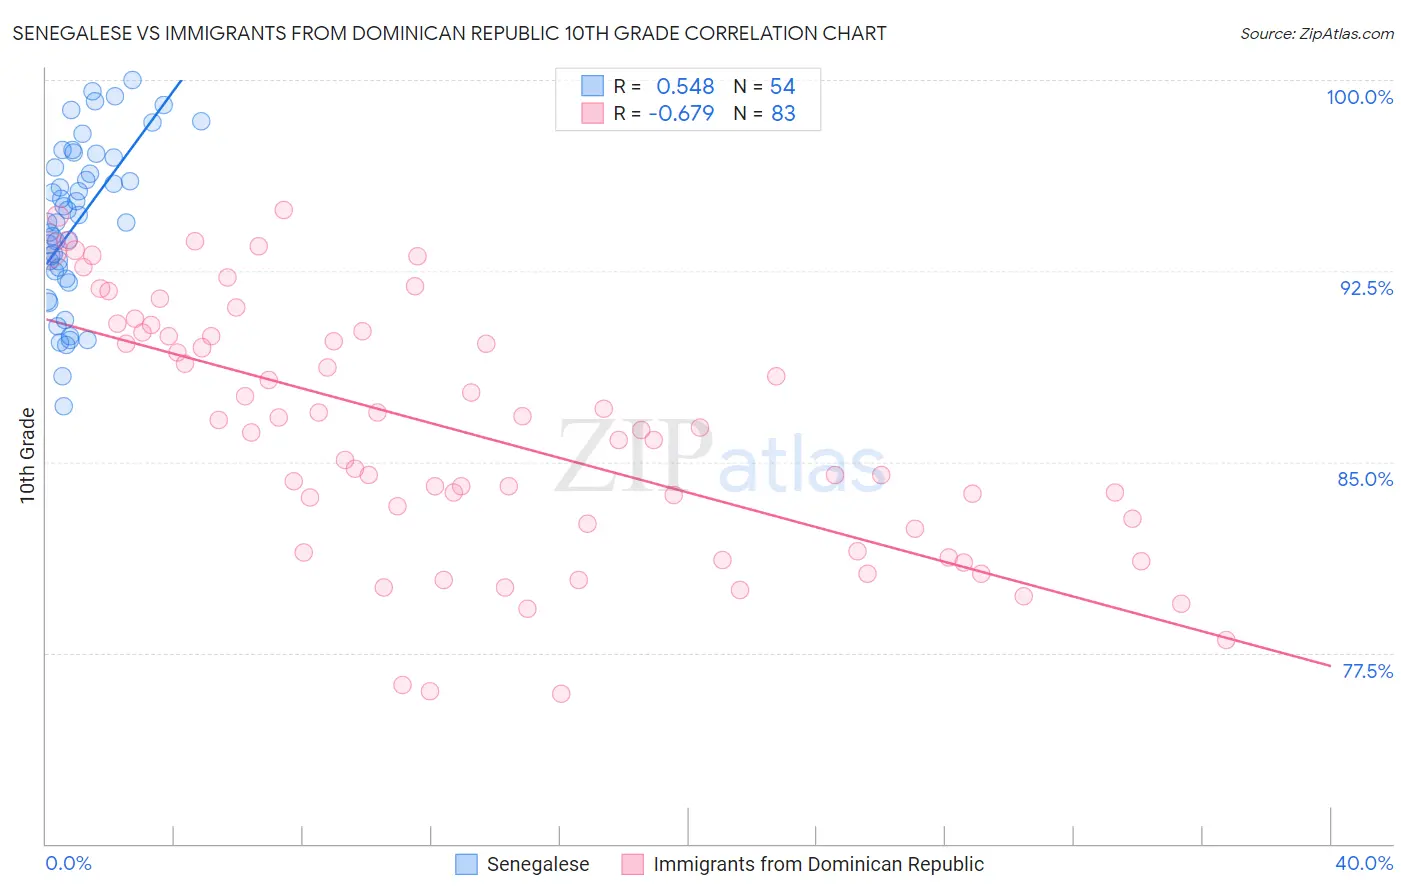
Senegalese vs Immigrants from Dominican Republic 10th Grade Correlation Chart
The statistical analysis conducted on geographies consisting of 78,142,569 people shows a substantial positive correlation between the proportion of Senegalese and percentage of population with at least 10th grade education in the United States with a correlation coefficient (R) of 0.548 and weighted average of 93.0%. Similarly, the statistical analysis conducted on geographies consisting of 275,144,349 people shows a significant negative correlation between the proportion of Immigrants from Dominican Republic and percentage of population with at least 10th grade education in the United States with a correlation coefficient (R) of -0.679 and weighted average of 88.7%, a difference of 4.8%.
10th Grade Correlation Summary
| Measurement | Senegalese | Immigrants from Dominican Republic |
| Minimum | 87.2% | 75.9% |
| Maximum | 100.0% | 94.9% |
| Range | 12.8% | 19.0% |
| Mean | 94.5% | 86.1% |
| Median | 94.6% | 86.3% |
| Interquartile 25% (IQ1) | 92.5% | 82.4% |
| Interquartile 75% (IQ3) | 96.9% | 90.1% |
| Interquartile Range (IQR) | 4.5% | 7.7% |
| Standard Deviation (Sample) | 3.1% | 4.9% |
| Standard Deviation (Population) | 3.1% | 4.8% |
Similar Demographics by 10th Grade
Demographics Similar to Senegalese by 10th Grade
In terms of 10th grade, the demographic groups most similar to Senegalese are Immigrants from Cameroon (93.0%, a difference of 0.020%), Immigrants from Somalia (93.0%, a difference of 0.030%), Spanish American (92.9%, a difference of 0.030%), Uruguayan (92.9%, a difference of 0.060%), and Immigrants from Middle Africa (92.9%, a difference of 0.080%).
| Demographics | Rating | Rank | 10th Grade |
| Afghans | 4.5 /100 | #236 | Tragic 93.1% |
| Immigrants | Panama | 4.3 /100 | #237 | Tragic 93.1% |
| Nigerians | 4.2 /100 | #238 | Tragic 93.1% |
| Costa Ricans | 4.2 /100 | #239 | Tragic 93.1% |
| Immigrants | Hong Kong | 4.2 /100 | #240 | Tragic 93.1% |
| Immigrants | Somalia | 2.7 /100 | #241 | Tragic 93.0% |
| Immigrants | Cameroon | 2.6 /100 | #242 | Tragic 93.0% |
| Senegalese | 2.4 /100 | #243 | Tragic 93.0% |
| Spanish Americans | 2.1 /100 | #244 | Tragic 92.9% |
| Uruguayans | 1.8 /100 | #245 | Tragic 92.9% |
| Immigrants | Middle Africa | 1.7 /100 | #246 | Tragic 92.9% |
| Immigrants | Afghanistan | 1.4 /100 | #247 | Tragic 92.8% |
| Colombians | 1.4 /100 | #248 | Tragic 92.8% |
| Immigrants | Senegal | 1.4 /100 | #249 | Tragic 92.8% |
| Jamaicans | 1.2 /100 | #250 | Tragic 92.8% |
Demographics Similar to Immigrants from Dominican Republic by 10th Grade
In terms of 10th grade, the demographic groups most similar to Immigrants from Dominican Republic are Hispanic or Latino (88.9%, a difference of 0.18%), Immigrants from Honduras (88.5%, a difference of 0.19%), Honduran (89.0%, a difference of 0.30%), Immigrants from the Azores (89.0%, a difference of 0.33%), and Central American (88.4%, a difference of 0.35%).
| Demographics | Rating | Rank | 10th Grade |
| Immigrants | Cabo Verde | 0.0 /100 | #328 | Tragic 89.5% |
| Dominicans | 0.0 /100 | #329 | Tragic 89.4% |
| Immigrants | Yemen | 0.0 /100 | #330 | Tragic 89.1% |
| Mexican American Indians | 0.0 /100 | #331 | Tragic 89.0% |
| Immigrants | Azores | 0.0 /100 | #332 | Tragic 89.0% |
| Hondurans | 0.0 /100 | #333 | Tragic 89.0% |
| Hispanics or Latinos | 0.0 /100 | #334 | Tragic 88.9% |
| Immigrants | Dominican Republic | 0.0 /100 | #335 | Tragic 88.7% |
| Immigrants | Honduras | 0.0 /100 | #336 | Tragic 88.5% |
| Central Americans | 0.0 /100 | #337 | Tragic 88.4% |
| Immigrants | Latin America | 0.0 /100 | #338 | Tragic 88.3% |
| Guatemalans | 0.0 /100 | #339 | Tragic 87.9% |
| Mexicans | 0.0 /100 | #340 | Tragic 87.8% |
| Salvadorans | 0.0 /100 | #341 | Tragic 87.5% |
| Immigrants | Guatemala | 0.0 /100 | #342 | Tragic 87.4% |