Senegalese vs Cheyenne Cognitive Disability
COMPARE
Senegalese
Cheyenne
Cognitive Disability
Cognitive Disability Comparison
Senegalese
Cheyenne
19.0%
COGNITIVE DISABILITY
0.0/ 100
METRIC RATING
335th/ 347
METRIC RANK
17.8%
COGNITIVE DISABILITY
1.7/ 100
METRIC RATING
238th/ 347
METRIC RANK
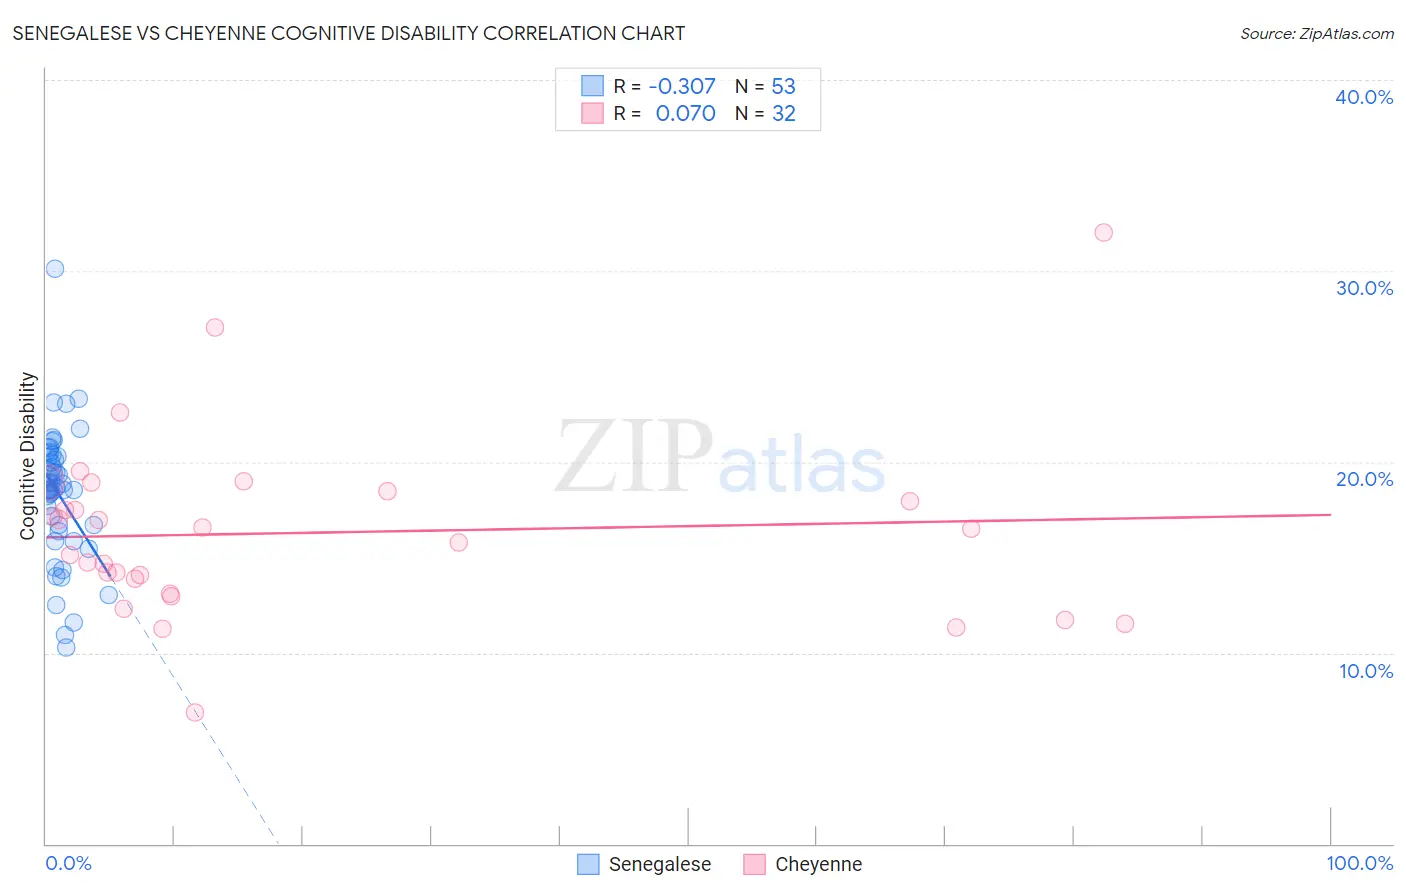
Senegalese vs Cheyenne Cognitive Disability Correlation Chart
The statistical analysis conducted on geographies consisting of 78,141,567 people shows a mild negative correlation between the proportion of Senegalese and percentage of population with cognitive disability in the United States with a correlation coefficient (R) of -0.307 and weighted average of 19.0%. Similarly, the statistical analysis conducted on geographies consisting of 80,710,475 people shows a slight positive correlation between the proportion of Cheyenne and percentage of population with cognitive disability in the United States with a correlation coefficient (R) of 0.070 and weighted average of 17.8%, a difference of 6.8%.
Cognitive Disability Correlation Summary
| Measurement | Senegalese | Cheyenne |
| Minimum | 10.3% | 6.9% |
| Maximum | 30.1% | 32.0% |
| Range | 19.8% | 25.1% |
| Mean | 18.3% | 16.3% |
| Median | 18.6% | 16.2% |
| Interquartile 25% (IQ1) | 16.5% | 13.5% |
| Interquartile 75% (IQ3) | 20.3% | 18.2% |
| Interquartile Range (IQR) | 3.8% | 4.7% |
| Standard Deviation (Sample) | 3.4% | 4.7% |
| Standard Deviation (Population) | 3.4% | 4.6% |
Similar Demographics by Cognitive Disability
Demographics Similar to Senegalese by Cognitive Disability
In terms of cognitive disability, the demographic groups most similar to Senegalese are Black/African American (19.0%, a difference of 0.29%), Immigrants from Saudi Arabia (19.1%, a difference of 0.42%), Sudanese (18.9%, a difference of 0.54%), Lumbee (19.1%, a difference of 0.77%), and Immigrants from Yemen (18.8%, a difference of 0.93%).
| Demographics | Rating | Rank | Cognitive Disability |
| Kiowa | 0.0 /100 | #328 | Tragic 18.7% |
| Navajo | 0.0 /100 | #329 | Tragic 18.8% |
| Immigrants | Dominican Republic | 0.0 /100 | #330 | Tragic 18.8% |
| Pima | 0.0 /100 | #331 | Tragic 18.8% |
| Immigrants | Sudan | 0.0 /100 | #332 | Tragic 18.8% |
| Immigrants | Yemen | 0.0 /100 | #333 | Tragic 18.8% |
| Sudanese | 0.0 /100 | #334 | Tragic 18.9% |
| Senegalese | 0.0 /100 | #335 | Tragic 19.0% |
| Blacks/African Americans | 0.0 /100 | #336 | Tragic 19.0% |
| Immigrants | Saudi Arabia | 0.0 /100 | #337 | Tragic 19.1% |
| Lumbee | 0.0 /100 | #338 | Tragic 19.1% |
| Puerto Ricans | 0.0 /100 | #339 | Tragic 19.2% |
| Cape Verdeans | 0.0 /100 | #340 | Tragic 19.2% |
| Tohono O'odham | 0.0 /100 | #341 | Tragic 19.3% |
| Houma | 0.0 /100 | #342 | Tragic 19.3% |
Demographics Similar to Cheyenne by Cognitive Disability
In terms of cognitive disability, the demographic groups most similar to Cheyenne are Immigrants from Iraq (17.8%, a difference of 0.040%), Immigrants from Mexico (17.8%, a difference of 0.040%), Osage (17.8%, a difference of 0.10%), Spanish American Indian (17.8%, a difference of 0.10%), and Panamanian (17.8%, a difference of 0.12%).
| Demographics | Rating | Rank | Cognitive Disability |
| Guatemalans | 2.1 /100 | #231 | Tragic 17.8% |
| Tongans | 2.1 /100 | #232 | Tragic 17.8% |
| Panamanians | 2.1 /100 | #233 | Tragic 17.8% |
| Osage | 2.0 /100 | #234 | Tragic 17.8% |
| Spanish American Indians | 2.0 /100 | #235 | Tragic 17.8% |
| Immigrants | Iraq | 1.8 /100 | #236 | Tragic 17.8% |
| Immigrants | Mexico | 1.8 /100 | #237 | Tragic 17.8% |
| Cheyenne | 1.7 /100 | #238 | Tragic 17.8% |
| Cajuns | 1.4 /100 | #239 | Tragic 17.8% |
| Iraqis | 1.4 /100 | #240 | Tragic 17.8% |
| Mexicans | 1.1 /100 | #241 | Tragic 17.8% |
| Paiute | 1.1 /100 | #242 | Tragic 17.8% |
| Immigrants | Bangladesh | 1.0 /100 | #243 | Tragic 17.8% |
| Jamaicans | 0.9 /100 | #244 | Tragic 17.9% |
| Trinidadians and Tobagonians | 0.8 /100 | #245 | Tragic 17.9% |