Senegalese vs Egyptian Cognitive Disability
COMPARE
Senegalese
Egyptian
Cognitive Disability
Cognitive Disability Comparison
Senegalese
Egyptians
19.0%
COGNITIVE DISABILITY
0.0/ 100
METRIC RATING
335th/ 347
METRIC RANK
16.7%
COGNITIVE DISABILITY
99.2/ 100
METRIC RATING
80th/ 347
METRIC RANK
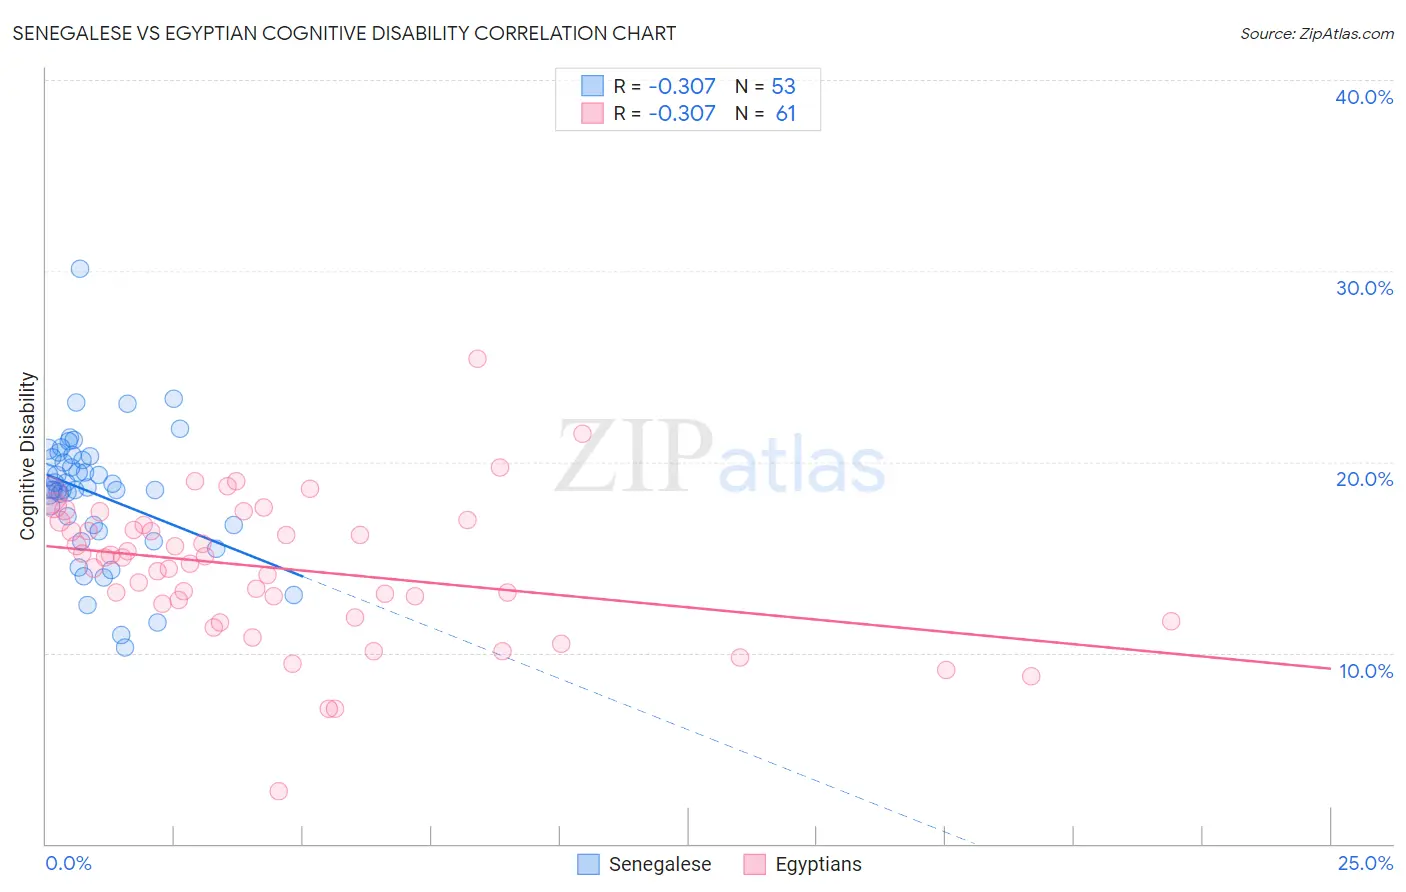
Senegalese vs Egyptian Cognitive Disability Correlation Chart
The statistical analysis conducted on geographies consisting of 78,141,567 people shows a mild negative correlation between the proportion of Senegalese and percentage of population with cognitive disability in the United States with a correlation coefficient (R) of -0.307 and weighted average of 19.0%. Similarly, the statistical analysis conducted on geographies consisting of 276,907,223 people shows a mild negative correlation between the proportion of Egyptians and percentage of population with cognitive disability in the United States with a correlation coefficient (R) of -0.307 and weighted average of 16.7%, a difference of 13.8%.
Cognitive Disability Correlation Summary
| Measurement | Senegalese | Egyptian |
| Minimum | 10.3% | 2.7% |
| Maximum | 30.1% | 25.4% |
| Range | 19.8% | 22.7% |
| Mean | 18.3% | 14.4% |
| Median | 18.6% | 15.0% |
| Interquartile 25% (IQ1) | 16.5% | 12.2% |
| Interquartile 75% (IQ3) | 20.3% | 16.8% |
| Interquartile Range (IQR) | 3.8% | 4.6% |
| Standard Deviation (Sample) | 3.4% | 3.8% |
| Standard Deviation (Population) | 3.4% | 3.7% |
Similar Demographics by Cognitive Disability
Demographics Similar to Senegalese by Cognitive Disability
In terms of cognitive disability, the demographic groups most similar to Senegalese are Black/African American (19.0%, a difference of 0.29%), Immigrants from Saudi Arabia (19.1%, a difference of 0.42%), Sudanese (18.9%, a difference of 0.54%), Lumbee (19.1%, a difference of 0.77%), and Immigrants from Yemen (18.8%, a difference of 0.93%).
| Demographics | Rating | Rank | Cognitive Disability |
| Kiowa | 0.0 /100 | #328 | Tragic 18.7% |
| Navajo | 0.0 /100 | #329 | Tragic 18.8% |
| Immigrants | Dominican Republic | 0.0 /100 | #330 | Tragic 18.8% |
| Pima | 0.0 /100 | #331 | Tragic 18.8% |
| Immigrants | Sudan | 0.0 /100 | #332 | Tragic 18.8% |
| Immigrants | Yemen | 0.0 /100 | #333 | Tragic 18.8% |
| Sudanese | 0.0 /100 | #334 | Tragic 18.9% |
| Senegalese | 0.0 /100 | #335 | Tragic 19.0% |
| Blacks/African Americans | 0.0 /100 | #336 | Tragic 19.0% |
| Immigrants | Saudi Arabia | 0.0 /100 | #337 | Tragic 19.1% |
| Lumbee | 0.0 /100 | #338 | Tragic 19.1% |
| Puerto Ricans | 0.0 /100 | #339 | Tragic 19.2% |
| Cape Verdeans | 0.0 /100 | #340 | Tragic 19.2% |
| Tohono O'odham | 0.0 /100 | #341 | Tragic 19.3% |
| Houma | 0.0 /100 | #342 | Tragic 19.3% |
Demographics Similar to Egyptians by Cognitive Disability
In terms of cognitive disability, the demographic groups most similar to Egyptians are Immigrants from Netherlands (16.7%, a difference of 0.010%), Peruvian (16.7%, a difference of 0.030%), Immigrants from Bulgaria (16.7%, a difference of 0.030%), Immigrants from Serbia (16.7%, a difference of 0.040%), and Immigrants from Hungary (16.7%, a difference of 0.040%).
| Demographics | Rating | Rank | Cognitive Disability |
| Burmese | 99.3 /100 | #73 | Exceptional 16.7% |
| Slavs | 99.3 /100 | #74 | Exceptional 16.7% |
| Estonians | 99.3 /100 | #75 | Exceptional 16.7% |
| Immigrants | Serbia | 99.3 /100 | #76 | Exceptional 16.7% |
| Immigrants | Hungary | 99.3 /100 | #77 | Exceptional 16.7% |
| Peruvians | 99.3 /100 | #78 | Exceptional 16.7% |
| Immigrants | Bulgaria | 99.3 /100 | #79 | Exceptional 16.7% |
| Egyptians | 99.2 /100 | #80 | Exceptional 16.7% |
| Immigrants | Netherlands | 99.2 /100 | #81 | Exceptional 16.7% |
| Swiss | 99.2 /100 | #82 | Exceptional 16.7% |
| Serbians | 99.1 /100 | #83 | Exceptional 16.7% |
| Belgians | 99.1 /100 | #84 | Exceptional 16.7% |
| Immigrants | Moldova | 99.1 /100 | #85 | Exceptional 16.7% |
| Immigrants | South Africa | 99.0 /100 | #86 | Exceptional 16.7% |
| Native Hawaiians | 99.0 /100 | #87 | Exceptional 16.7% |