Senegalese vs Danish Householder Income Ages 45 - 64 years
COMPARE
Senegalese
Danish
Householder Income Ages 45 - 64 years
Householder Income Ages 45 - 64 years Comparison
Senegalese
Danes
$86,897
HOUSEHOLDER INCOME AGES 45 - 64 YEARS
0.1/ 100
METRIC RATING
282nd/ 347
METRIC RANK
$105,619
HOUSEHOLDER INCOME AGES 45 - 64 YEARS
93.4/ 100
METRIC RATING
123rd/ 347
METRIC RANK
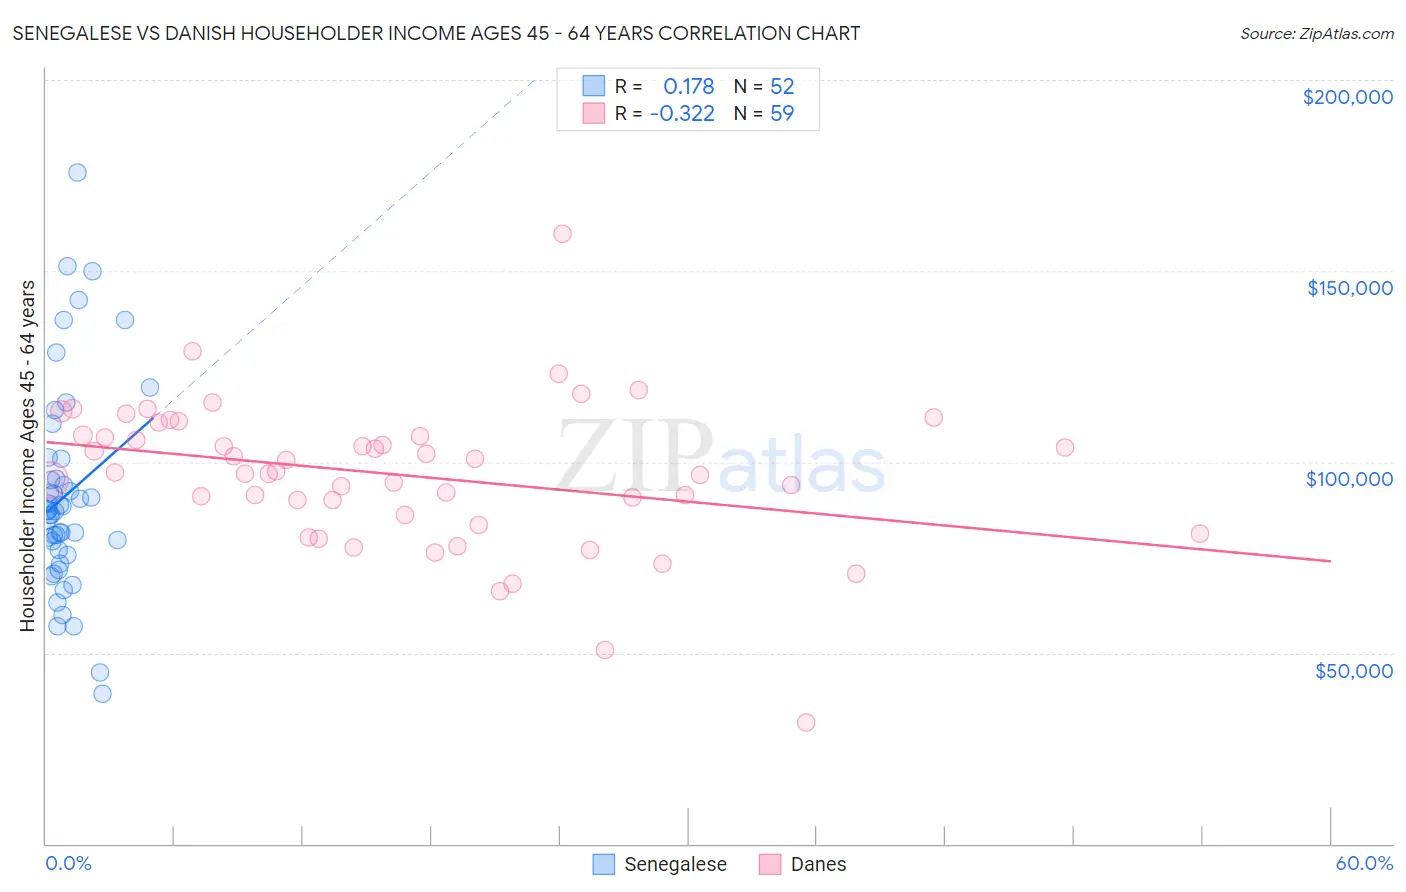
Senegalese vs Danish Householder Income Ages 45 - 64 years Correlation Chart
The statistical analysis conducted on geographies consisting of 78,071,006 people shows a poor positive correlation between the proportion of Senegalese and household income with householder between the ages 45 and 64 in the United States with a correlation coefficient (R) of 0.178 and weighted average of $86,897. Similarly, the statistical analysis conducted on geographies consisting of 472,904,213 people shows a mild negative correlation between the proportion of Danes and household income with householder between the ages 45 and 64 in the United States with a correlation coefficient (R) of -0.322 and weighted average of $105,619, a difference of 21.5%.
Householder Income Ages 45 - 64 years Correlation Summary
| Measurement | Senegalese | Danish |
| Minimum | $39,353 | $31,738 |
| Maximum | $175,761 | $159,821 |
| Range | $136,408 | $128,083 |
| Mean | $91,310 | $96,518 |
| Median | $87,120 | $97,157 |
| Interquartile 25% (IQ1) | $76,238 | $86,244 |
| Interquartile 75% (IQ3) | $98,209 | $106,951 |
| Interquartile Range (IQR) | $21,971 | $20,707 |
| Standard Deviation (Sample) | $27,351 | $19,437 |
| Standard Deviation (Population) | $27,087 | $19,272 |
Similar Demographics by Householder Income Ages 45 - 64 years
Demographics Similar to Senegalese by Householder Income Ages 45 - 64 years
In terms of householder income ages 45 - 64 years, the demographic groups most similar to Senegalese are Yaqui ($86,914, a difference of 0.020%), Mexican ($86,816, a difference of 0.090%), Immigrants from Somalia ($86,987, a difference of 0.10%), Yakama ($86,992, a difference of 0.11%), and Central American Indian ($86,764, a difference of 0.15%).
| Demographics | Rating | Rank | Householder Income Ages 45 - 64 years |
| Immigrants | Belize | 0.1 /100 | #275 | Tragic $87,229 |
| Immigrants | Latin America | 0.1 /100 | #276 | Tragic $87,219 |
| Cree | 0.1 /100 | #277 | Tragic $87,185 |
| Immigrants | Jamaica | 0.1 /100 | #278 | Tragic $87,035 |
| Yakama | 0.1 /100 | #279 | Tragic $86,992 |
| Immigrants | Somalia | 0.1 /100 | #280 | Tragic $86,987 |
| Yaqui | 0.1 /100 | #281 | Tragic $86,914 |
| Senegalese | 0.1 /100 | #282 | Tragic $86,897 |
| Mexicans | 0.1 /100 | #283 | Tragic $86,816 |
| Central American Indians | 0.1 /100 | #284 | Tragic $86,764 |
| Blackfeet | 0.1 /100 | #285 | Tragic $86,595 |
| Immigrants | Guatemala | 0.1 /100 | #286 | Tragic $86,573 |
| Bangladeshis | 0.1 /100 | #287 | Tragic $86,402 |
| Immigrants | St. Vincent and the Grenadines | 0.1 /100 | #288 | Tragic $86,394 |
| Cubans | 0.1 /100 | #289 | Tragic $86,301 |
Demographics Similar to Danes by Householder Income Ages 45 - 64 years
In terms of householder income ages 45 - 64 years, the demographic groups most similar to Danes are Immigrants from Northern Africa ($105,430, a difference of 0.18%), Immigrants from North Macedonia ($105,892, a difference of 0.26%), Pakistani ($105,317, a difference of 0.29%), Portuguese ($105,309, a difference of 0.29%), and Polish ($105,952, a difference of 0.32%).
| Demographics | Rating | Rank | Householder Income Ages 45 - 64 years |
| British | 95.2 /100 | #116 | Exceptional $106,264 |
| Albanians | 95.1 /100 | #117 | Exceptional $106,243 |
| Immigrants | Western Asia | 95.0 /100 | #118 | Exceptional $106,217 |
| Immigrants | Jordan | 94.9 /100 | #119 | Exceptional $106,164 |
| Immigrants | South Eastern Asia | 94.8 /100 | #120 | Exceptional $106,109 |
| Poles | 94.4 /100 | #121 | Exceptional $105,952 |
| Immigrants | North Macedonia | 94.2 /100 | #122 | Exceptional $105,892 |
| Danes | 93.4 /100 | #123 | Exceptional $105,619 |
| Immigrants | Northern Africa | 92.8 /100 | #124 | Exceptional $105,430 |
| Pakistanis | 92.4 /100 | #125 | Exceptional $105,317 |
| Portuguese | 92.4 /100 | #126 | Exceptional $105,309 |
| Immigrants | Saudi Arabia | 92.2 /100 | #127 | Exceptional $105,249 |
| Native Hawaiians | 91.8 /100 | #128 | Exceptional $105,149 |
| Peruvians | 91.5 /100 | #129 | Exceptional $105,070 |
| Immigrants | Zimbabwe | 91.2 /100 | #130 | Exceptional $104,992 |