Macedonian vs Danish Female Disability
COMPARE
Macedonian
Danish
Female Disability
Female Disability Comparison
Macedonians
Danes
11.8%
FEMALE DISABILITY
95.5/ 100
METRIC RATING
129th/ 347
METRIC RANK
12.1%
FEMALE DISABILITY
72.5/ 100
METRIC RATING
157th/ 347
METRIC RANK
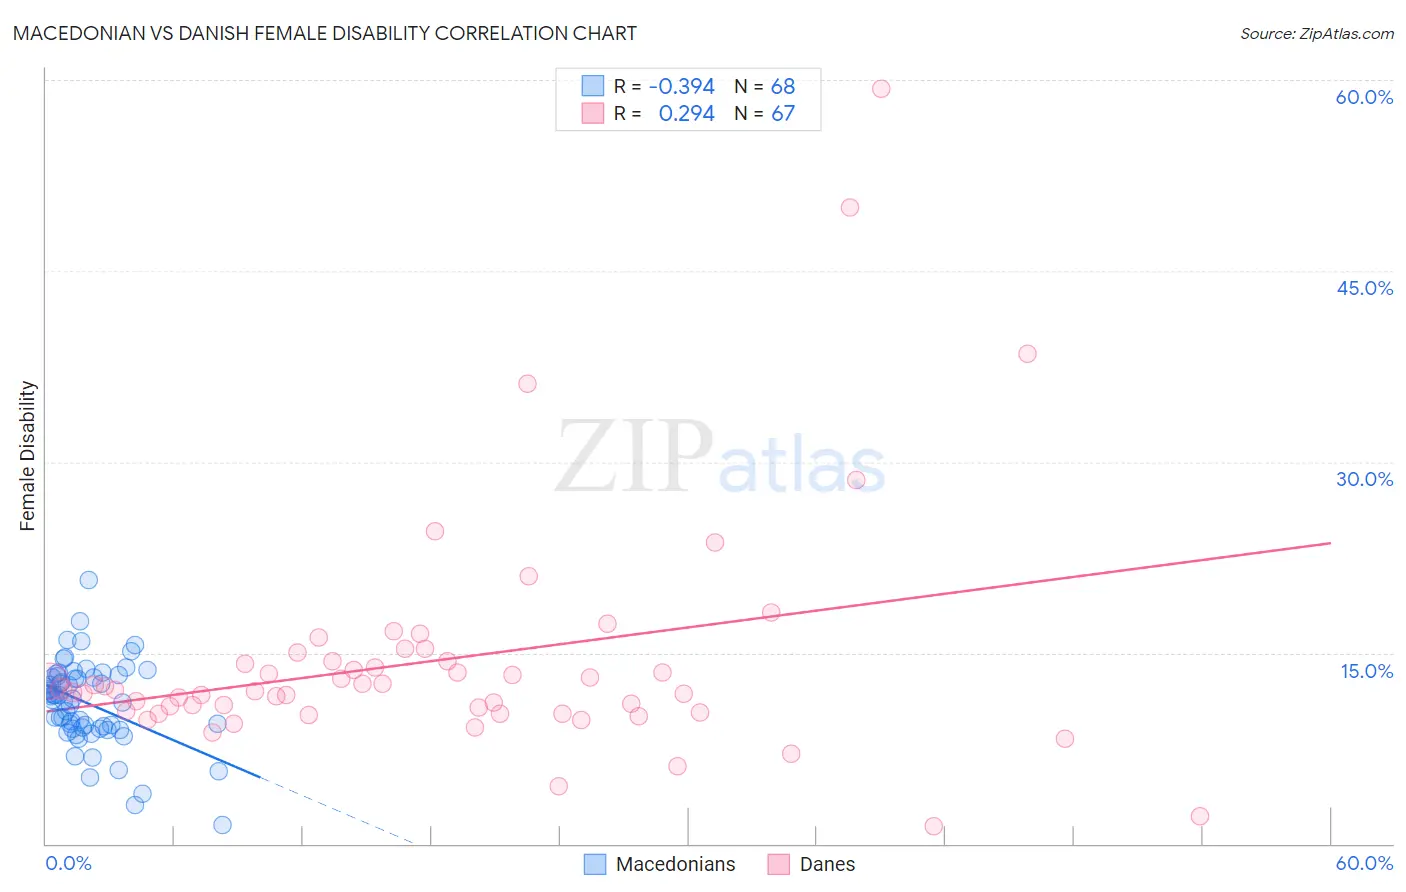
Macedonian vs Danish Female Disability Correlation Chart
The statistical analysis conducted on geographies consisting of 132,656,541 people shows a mild negative correlation between the proportion of Macedonians and percentage of females with a disability in the United States with a correlation coefficient (R) of -0.394 and weighted average of 11.8%. Similarly, the statistical analysis conducted on geographies consisting of 474,084,483 people shows a weak positive correlation between the proportion of Danes and percentage of females with a disability in the United States with a correlation coefficient (R) of 0.294 and weighted average of 12.1%, a difference of 2.0%.
Female Disability Correlation Summary
| Measurement | Macedonian | Danish |
| Minimum | 1.4% | 1.4% |
| Maximum | 20.8% | 59.3% |
| Range | 19.3% | 58.0% |
| Mean | 11.0% | 14.4% |
| Median | 11.5% | 12.1% |
| Interquartile 25% (IQ1) | 9.1% | 10.3% |
| Interquartile 75% (IQ3) | 13.1% | 14.3% |
| Interquartile Range (IQR) | 4.0% | 4.0% |
| Standard Deviation (Sample) | 3.3% | 9.4% |
| Standard Deviation (Population) | 3.3% | 9.3% |
Similar Demographics by Female Disability
Demographics Similar to Macedonians by Female Disability
In terms of female disability, the demographic groups most similar to Macedonians are Immigrants from Latvia (11.8%, a difference of 0.030%), Nicaraguan (11.9%, a difference of 0.060%), South American Indian (11.8%, a difference of 0.070%), Arab (11.9%, a difference of 0.090%), and Immigrants from Europe (11.8%, a difference of 0.17%).
| Demographics | Rating | Rank | Female Disability |
| Immigrants | North Macedonia | 96.8 /100 | #122 | Exceptional 11.8% |
| Immigrants | Croatia | 96.7 /100 | #123 | Exceptional 11.8% |
| Russians | 96.5 /100 | #124 | Exceptional 11.8% |
| Immigrants | Italy | 96.4 /100 | #125 | Exceptional 11.8% |
| Immigrants | Europe | 96.2 /100 | #126 | Exceptional 11.8% |
| South American Indians | 95.8 /100 | #127 | Exceptional 11.8% |
| Immigrants | Latvia | 95.6 /100 | #128 | Exceptional 11.8% |
| Macedonians | 95.5 /100 | #129 | Exceptional 11.8% |
| Nicaraguans | 95.2 /100 | #130 | Exceptional 11.9% |
| Arabs | 95.1 /100 | #131 | Exceptional 11.9% |
| Immigrants | Syria | 94.6 /100 | #132 | Exceptional 11.9% |
| Kenyans | 94.5 /100 | #133 | Exceptional 11.9% |
| Immigrants | Nicaragua | 94.5 /100 | #134 | Exceptional 11.9% |
| Central Americans | 94.2 /100 | #135 | Exceptional 11.9% |
| Ugandans | 94.0 /100 | #136 | Exceptional 11.9% |
Demographics Similar to Danes by Female Disability
In terms of female disability, the demographic groups most similar to Danes are Immigrants from Middle Africa (12.1%, a difference of 0.010%), Moroccan (12.1%, a difference of 0.020%), Ghanaian (12.1%, a difference of 0.20%), Syrian (12.1%, a difference of 0.22%), and Immigrants from Central America (12.1%, a difference of 0.22%).
| Demographics | Rating | Rank | Female Disability |
| Immigrants | Moldova | 81.4 /100 | #150 | Excellent 12.0% |
| Icelanders | 80.7 /100 | #151 | Excellent 12.0% |
| Immigrants | Scotland | 79.3 /100 | #152 | Good 12.0% |
| Sudanese | 79.1 /100 | #153 | Good 12.0% |
| Syrians | 76.9 /100 | #154 | Good 12.1% |
| Ghanaians | 76.6 /100 | #155 | Good 12.1% |
| Moroccans | 72.9 /100 | #156 | Good 12.1% |
| Danes | 72.5 /100 | #157 | Good 12.1% |
| Immigrants | Middle Africa | 72.4 /100 | #158 | Good 12.1% |
| Immigrants | Central America | 67.7 /100 | #159 | Good 12.1% |
| Immigrants | Guatemala | 66.0 /100 | #160 | Good 12.1% |
| Guyanese | 64.7 /100 | #161 | Good 12.1% |
| Immigrants | Ukraine | 64.3 /100 | #162 | Good 12.1% |
| Guatemalans | 63.8 /100 | #163 | Good 12.1% |
| Czechs | 63.6 /100 | #164 | Good 12.1% |