Senegalese vs Cheyenne 4th Grade
COMPARE
Senegalese
Cheyenne
4th Grade
4th Grade Comparison
Senegalese
Cheyenne
97.2%
4TH GRADE
3.1/ 100
METRIC RATING
233rd/ 347
METRIC RANK
97.9%
4TH GRADE
98.4/ 100
METRIC RATING
97th/ 347
METRIC RANK
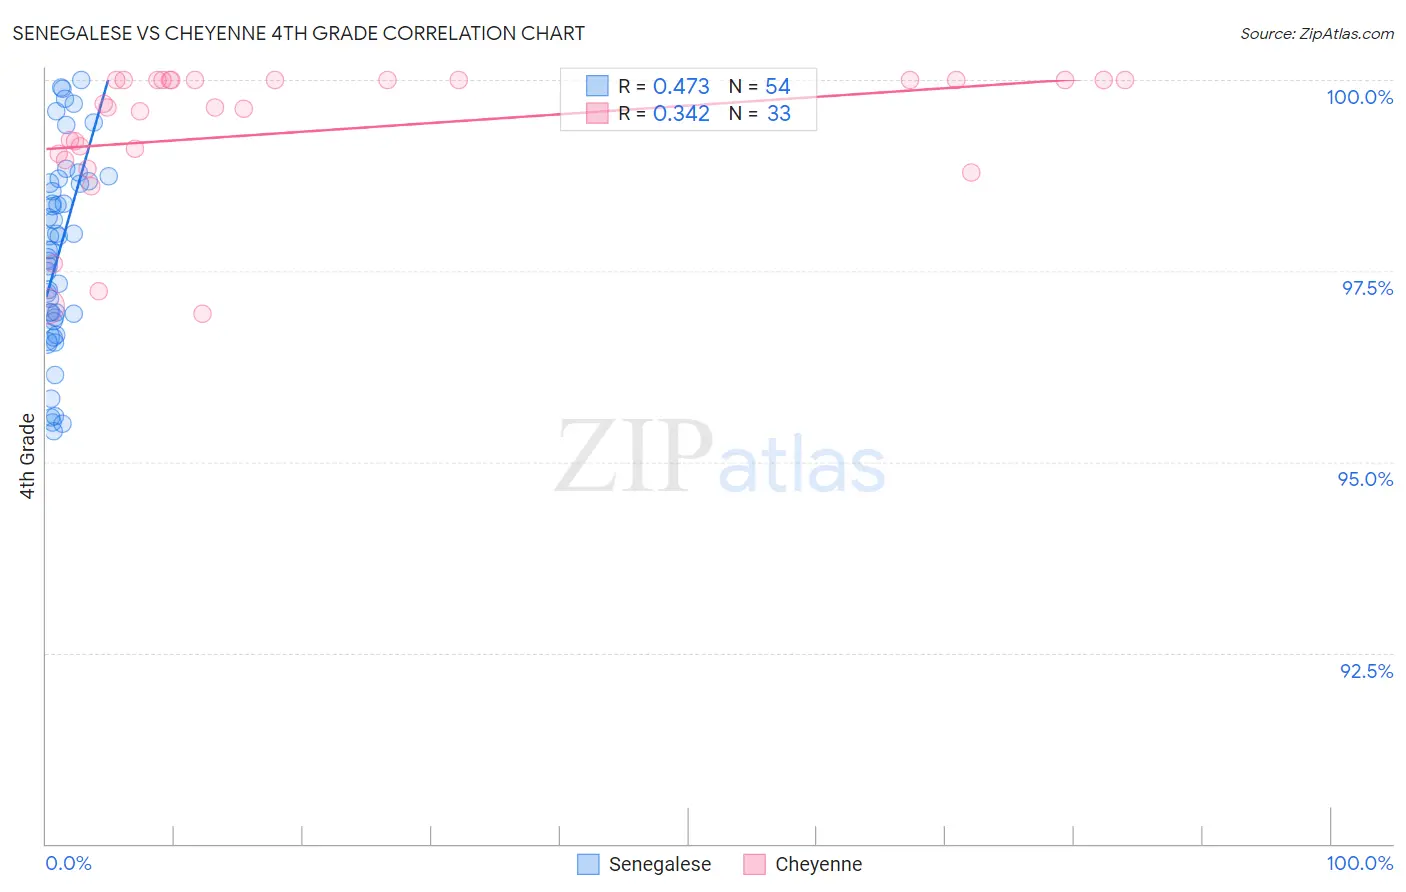
Senegalese vs Cheyenne 4th Grade Correlation Chart
The statistical analysis conducted on geographies consisting of 78,142,569 people shows a moderate positive correlation between the proportion of Senegalese and percentage of population with at least 4th grade education in the United States with a correlation coefficient (R) of 0.473 and weighted average of 97.2%. Similarly, the statistical analysis conducted on geographies consisting of 80,716,760 people shows a mild positive correlation between the proportion of Cheyenne and percentage of population with at least 4th grade education in the United States with a correlation coefficient (R) of 0.342 and weighted average of 97.9%, a difference of 0.72%.
4th Grade Correlation Summary
| Measurement | Senegalese | Cheyenne |
| Minimum | 95.4% | 96.9% |
| Maximum | 100.0% | 100.0% |
| Range | 4.6% | 3.1% |
| Mean | 97.7% | 99.3% |
| Median | 97.8% | 99.6% |
| Interquartile 25% (IQ1) | 96.9% | 99.0% |
| Interquartile 75% (IQ3) | 98.6% | 100.0% |
| Interquartile Range (IQR) | 1.8% | 1.0% |
| Standard Deviation (Sample) | 1.3% | 0.92% |
| Standard Deviation (Population) | 1.2% | 0.90% |
Similar Demographics by 4th Grade
Demographics Similar to Senegalese by 4th Grade
In terms of 4th grade, the demographic groups most similar to Senegalese are Assyrian/Chaldean/Syriac (97.2%, a difference of 0.0%), Subsaharan African (97.2%, a difference of 0.010%), Liberian (97.2%, a difference of 0.010%), Uruguayan (97.2%, a difference of 0.010%), and Immigrants from Malaysia (97.2%, a difference of 0.010%).
| Demographics | Rating | Rank | 4th Grade |
| Bahamians | 3.8 /100 | #226 | Tragic 97.2% |
| Immigrants | Pakistan | 3.7 /100 | #227 | Tragic 97.2% |
| Sub-Saharan Africans | 3.6 /100 | #228 | Tragic 97.2% |
| Liberians | 3.6 /100 | #229 | Tragic 97.2% |
| Uruguayans | 3.5 /100 | #230 | Tragic 97.2% |
| Immigrants | Malaysia | 3.4 /100 | #231 | Tragic 97.2% |
| Immigrants | Western Asia | 3.4 /100 | #232 | Tragic 97.2% |
| Senegalese | 3.1 /100 | #233 | Tragic 97.2% |
| Assyrians/Chaldeans/Syriacs | 3.0 /100 | #234 | Tragic 97.2% |
| Yuman | 2.9 /100 | #235 | Tragic 97.2% |
| Immigrants | Eastern Asia | 2.7 /100 | #236 | Tragic 97.2% |
| Immigrants | Costa Rica | 2.0 /100 | #237 | Tragic 97.2% |
| Indians (Asian) | 1.9 /100 | #238 | Tragic 97.2% |
| Nigerians | 1.8 /100 | #239 | Tragic 97.1% |
| Colombians | 1.6 /100 | #240 | Tragic 97.1% |
Demographics Similar to Cheyenne by 4th Grade
In terms of 4th grade, the demographic groups most similar to Cheyenne are Romanian (97.9%, a difference of 0.0%), Immigrants from Germany (97.9%, a difference of 0.010%), South African (97.9%, a difference of 0.010%), Turkish (97.9%, a difference of 0.010%), and Yugoslavian (97.9%, a difference of 0.010%).
| Demographics | Rating | Rank | 4th Grade |
| Immigrants | Denmark | 98.7 /100 | #90 | Exceptional 97.9% |
| Immigrants | Sweden | 98.7 /100 | #91 | Exceptional 97.9% |
| Immigrants | Western Europe | 98.7 /100 | #92 | Exceptional 97.9% |
| Immigrants | Ireland | 98.7 /100 | #93 | Exceptional 97.9% |
| Shoshone | 98.7 /100 | #94 | Exceptional 97.9% |
| Immigrants | Germany | 98.5 /100 | #95 | Exceptional 97.9% |
| Romanians | 98.4 /100 | #96 | Exceptional 97.9% |
| Cheyenne | 98.4 /100 | #97 | Exceptional 97.9% |
| South Africans | 98.2 /100 | #98 | Exceptional 97.9% |
| Turks | 98.2 /100 | #99 | Exceptional 97.9% |
| Yugoslavians | 98.1 /100 | #100 | Exceptional 97.9% |
| Cree | 98.1 /100 | #101 | Exceptional 97.9% |
| Choctaw | 97.9 /100 | #102 | Exceptional 97.9% |
| Puget Sound Salish | 97.7 /100 | #103 | Exceptional 97.9% |
| Immigrants | Nonimmigrants | 97.5 /100 | #104 | Exceptional 97.9% |