Seminole vs Salvadoran Male Disability
COMPARE
Seminole
Salvadoran
Male Disability
Male Disability Comparison
Seminole
Salvadorans
14.7%
MALE DISABILITY
0.0/ 100
METRIC RATING
332nd/ 347
METRIC RANK
10.4%
MALE DISABILITY
99.6/ 100
METRIC RATING
51st/ 347
METRIC RANK
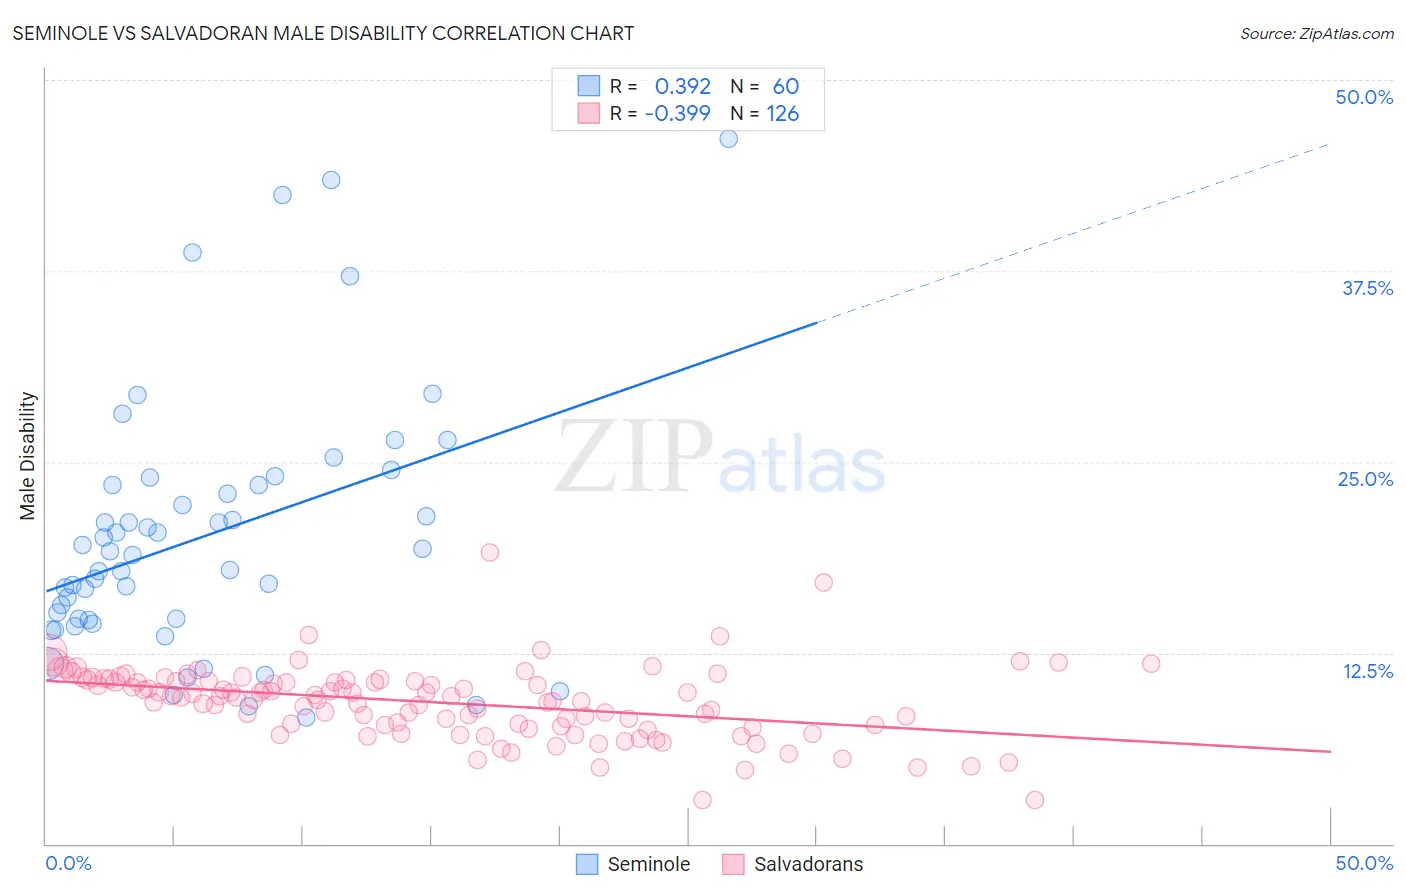
Seminole vs Salvadoran Male Disability Correlation Chart
The statistical analysis conducted on geographies consisting of 118,308,545 people shows a mild positive correlation between the proportion of Seminole and percentage of males with a disability in the United States with a correlation coefficient (R) of 0.392 and weighted average of 14.7%. Similarly, the statistical analysis conducted on geographies consisting of 398,921,058 people shows a mild negative correlation between the proportion of Salvadorans and percentage of males with a disability in the United States with a correlation coefficient (R) of -0.399 and weighted average of 10.4%, a difference of 42.1%.
Male Disability Correlation Summary
| Measurement | Seminole | Salvadoran |
| Minimum | 8.3% | 2.9% |
| Maximum | 46.2% | 19.1% |
| Range | 37.9% | 16.2% |
| Mean | 20.2% | 9.3% |
| Median | 19.0% | 9.6% |
| Interquartile 25% (IQ1) | 14.7% | 7.7% |
| Interquartile 75% (IQ3) | 23.5% | 10.6% |
| Interquartile Range (IQR) | 8.8% | 2.9% |
| Standard Deviation (Sample) | 8.4% | 2.4% |
| Standard Deviation (Population) | 8.3% | 2.3% |
Similar Demographics by Male Disability
Demographics Similar to Seminole by Male Disability
In terms of male disability, the demographic groups most similar to Seminole are Yuman (14.7%, a difference of 0.10%), Tohono O'odham (14.6%, a difference of 0.78%), Cherokee (14.8%, a difference of 0.78%), Dutch West Indian (14.8%, a difference of 0.80%), and Alaskan Athabascan (14.9%, a difference of 1.3%).
| Demographics | Rating | Rank | Male Disability |
| Ottawa | 0.0 /100 | #325 | Tragic 14.1% |
| Natives/Alaskans | 0.0 /100 | #326 | Tragic 14.2% |
| Potawatomi | 0.0 /100 | #327 | Tragic 14.2% |
| Chippewa | 0.0 /100 | #328 | Tragic 14.3% |
| Cajuns | 0.0 /100 | #329 | Tragic 14.4% |
| Navajo | 0.0 /100 | #330 | Tragic 14.4% |
| Tohono O'odham | 0.0 /100 | #331 | Tragic 14.6% |
| Seminole | 0.0 /100 | #332 | Tragic 14.7% |
| Yuman | 0.0 /100 | #333 | Tragic 14.7% |
| Cherokee | 0.0 /100 | #334 | Tragic 14.8% |
| Dutch West Indians | 0.0 /100 | #335 | Tragic 14.8% |
| Alaskan Athabascans | 0.0 /100 | #336 | Tragic 14.9% |
| Menominee | 0.0 /100 | #337 | Tragic 15.0% |
| Pueblo | 0.0 /100 | #338 | Tragic 15.0% |
| Chickasaw | 0.0 /100 | #339 | Tragic 15.1% |
Demographics Similar to Salvadorans by Male Disability
In terms of male disability, the demographic groups most similar to Salvadorans are Immigrants from Saudi Arabia (10.4%, a difference of 0.020%), Immigrants from Uzbekistan (10.4%, a difference of 0.040%), Peruvian (10.4%, a difference of 0.080%), Immigrants from Eritrea (10.4%, a difference of 0.10%), and Tongan (10.4%, a difference of 0.14%).
| Demographics | Rating | Rank | Male Disability |
| Immigrants | El Salvador | 99.7 /100 | #44 | Exceptional 10.3% |
| Turks | 99.7 /100 | #45 | Exceptional 10.3% |
| Cambodians | 99.7 /100 | #46 | Exceptional 10.3% |
| Immigrants | Peru | 99.7 /100 | #47 | Exceptional 10.3% |
| Israelis | 99.7 /100 | #48 | Exceptional 10.3% |
| Immigrants | Spain | 99.7 /100 | #49 | Exceptional 10.3% |
| South Americans | 99.6 /100 | #50 | Exceptional 10.3% |
| Salvadorans | 99.6 /100 | #51 | Exceptional 10.4% |
| Immigrants | Saudi Arabia | 99.6 /100 | #52 | Exceptional 10.4% |
| Immigrants | Uzbekistan | 99.6 /100 | #53 | Exceptional 10.4% |
| Peruvians | 99.6 /100 | #54 | Exceptional 10.4% |
| Immigrants | Eritrea | 99.6 /100 | #55 | Exceptional 10.4% |
| Tongans | 99.6 /100 | #56 | Exceptional 10.4% |
| Immigrants | South America | 99.6 /100 | #57 | Exceptional 10.4% |
| Immigrants | Japan | 99.5 /100 | #58 | Exceptional 10.4% |