Seminole vs Guamanian/Chamorro Male Disability
COMPARE
Seminole
Guamanian/Chamorro
Male Disability
Male Disability Comparison
Seminole
Guamanians/Chamorros
14.7%
MALE DISABILITY
0.0/ 100
METRIC RATING
332nd/ 347
METRIC RANK
12.0%
MALE DISABILITY
0.5/ 100
METRIC RATING
253rd/ 347
METRIC RANK
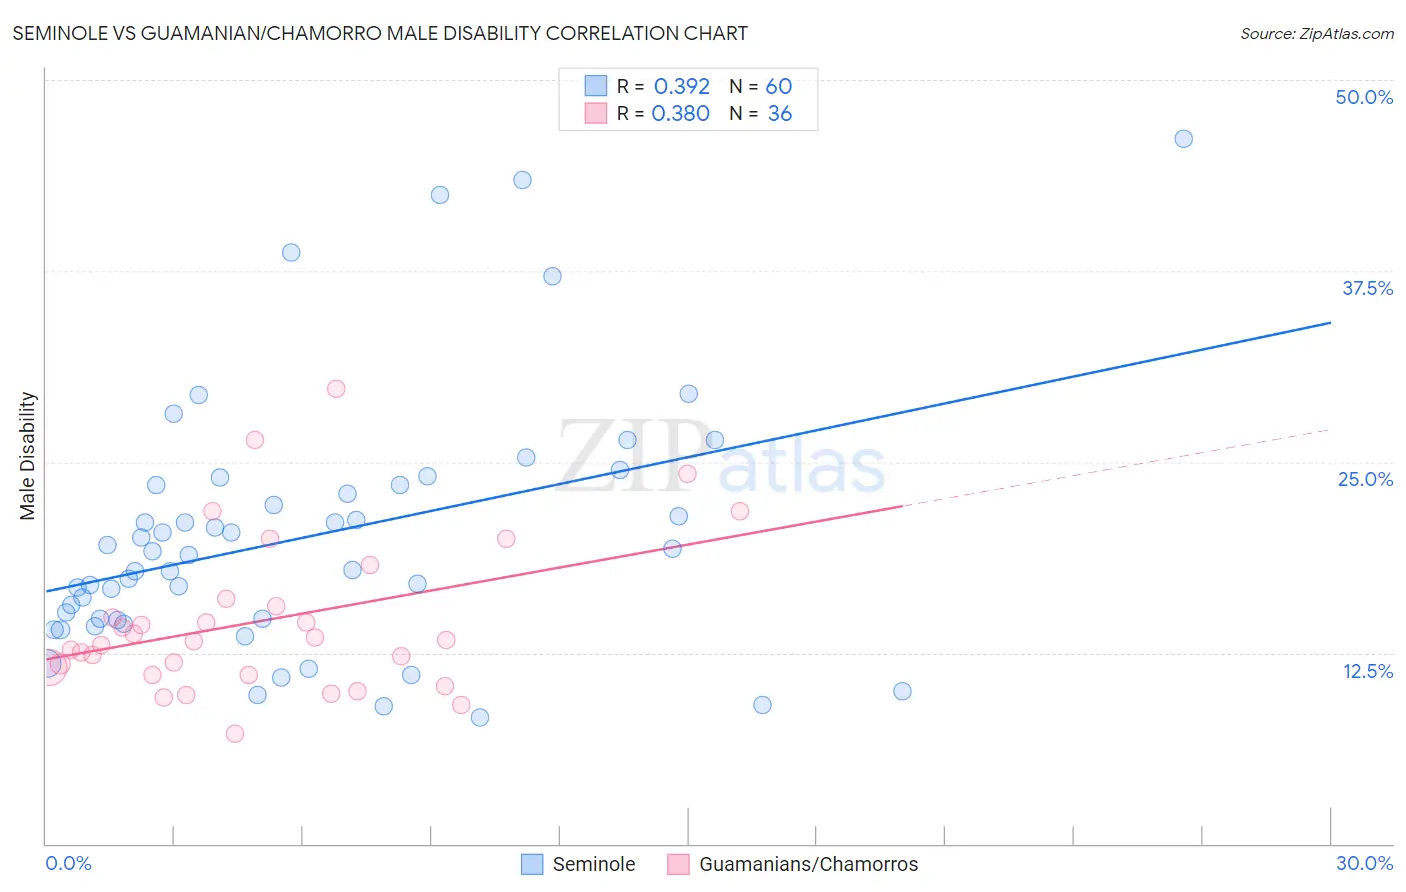
Seminole vs Guamanian/Chamorro Male Disability Correlation Chart
The statistical analysis conducted on geographies consisting of 118,308,545 people shows a mild positive correlation between the proportion of Seminole and percentage of males with a disability in the United States with a correlation coefficient (R) of 0.392 and weighted average of 14.7%. Similarly, the statistical analysis conducted on geographies consisting of 221,895,319 people shows a mild positive correlation between the proportion of Guamanians/Chamorros and percentage of males with a disability in the United States with a correlation coefficient (R) of 0.380 and weighted average of 12.0%, a difference of 22.3%.
Male Disability Correlation Summary
| Measurement | Seminole | Guamanian/Chamorro |
| Minimum | 8.3% | 7.2% |
| Maximum | 46.2% | 29.8% |
| Range | 37.9% | 22.5% |
| Mean | 20.2% | 14.6% |
| Median | 19.0% | 13.3% |
| Interquartile 25% (IQ1) | 14.7% | 11.3% |
| Interquartile 75% (IQ3) | 23.5% | 15.8% |
| Interquartile Range (IQR) | 8.8% | 4.5% |
| Standard Deviation (Sample) | 8.4% | 5.1% |
| Standard Deviation (Population) | 8.3% | 5.0% |
Similar Demographics by Male Disability
Demographics Similar to Seminole by Male Disability
In terms of male disability, the demographic groups most similar to Seminole are Yuman (14.7%, a difference of 0.10%), Tohono O'odham (14.6%, a difference of 0.78%), Cherokee (14.8%, a difference of 0.78%), Dutch West Indian (14.8%, a difference of 0.80%), and Alaskan Athabascan (14.9%, a difference of 1.3%).
| Demographics | Rating | Rank | Male Disability |
| Ottawa | 0.0 /100 | #325 | Tragic 14.1% |
| Natives/Alaskans | 0.0 /100 | #326 | Tragic 14.2% |
| Potawatomi | 0.0 /100 | #327 | Tragic 14.2% |
| Chippewa | 0.0 /100 | #328 | Tragic 14.3% |
| Cajuns | 0.0 /100 | #329 | Tragic 14.4% |
| Navajo | 0.0 /100 | #330 | Tragic 14.4% |
| Tohono O'odham | 0.0 /100 | #331 | Tragic 14.6% |
| Seminole | 0.0 /100 | #332 | Tragic 14.7% |
| Yuman | 0.0 /100 | #333 | Tragic 14.7% |
| Cherokee | 0.0 /100 | #334 | Tragic 14.8% |
| Dutch West Indians | 0.0 /100 | #335 | Tragic 14.8% |
| Alaskan Athabascans | 0.0 /100 | #336 | Tragic 14.9% |
| Menominee | 0.0 /100 | #337 | Tragic 15.0% |
| Pueblo | 0.0 /100 | #338 | Tragic 15.0% |
| Chickasaw | 0.0 /100 | #339 | Tragic 15.1% |
Demographics Similar to Guamanians/Chamorros by Male Disability
In terms of male disability, the demographic groups most similar to Guamanians/Chamorros are Slovene (12.0%, a difference of 0.0%), German Russian (12.0%, a difference of 0.070%), Bangladeshi (12.0%, a difference of 0.080%), Immigrants from Yemen (12.0%, a difference of 0.13%), and British (12.1%, a difference of 0.18%).
| Demographics | Rating | Rank | Male Disability |
| Danes | 0.9 /100 | #246 | Tragic 11.9% |
| Hungarians | 0.8 /100 | #247 | Tragic 12.0% |
| Poles | 0.7 /100 | #248 | Tragic 12.0% |
| Immigrants | Yemen | 0.5 /100 | #249 | Tragic 12.0% |
| Bangladeshis | 0.5 /100 | #250 | Tragic 12.0% |
| German Russians | 0.5 /100 | #251 | Tragic 12.0% |
| Slovenes | 0.5 /100 | #252 | Tragic 12.0% |
| Guamanians/Chamorros | 0.5 /100 | #253 | Tragic 12.0% |
| British | 0.4 /100 | #254 | Tragic 12.1% |
| Chinese | 0.4 /100 | #255 | Tragic 12.1% |
| Swiss | 0.3 /100 | #256 | Tragic 12.1% |
| Europeans | 0.3 /100 | #257 | Tragic 12.1% |
| Basques | 0.3 /100 | #258 | Tragic 12.1% |
| Belgians | 0.3 /100 | #259 | Tragic 12.1% |
| Swedes | 0.3 /100 | #260 | Tragic 12.1% |