Scottish vs Hawaiian Vision Disability
COMPARE
Scottish
Hawaiian
Vision Disability
Vision Disability Comparison
Scottish
Hawaiians
2.3%
VISION DISABILITY
1.6/ 100
METRIC RATING
234th/ 347
METRIC RANK
2.3%
VISION DISABILITY
2.9/ 100
METRIC RATING
227th/ 347
METRIC RANK
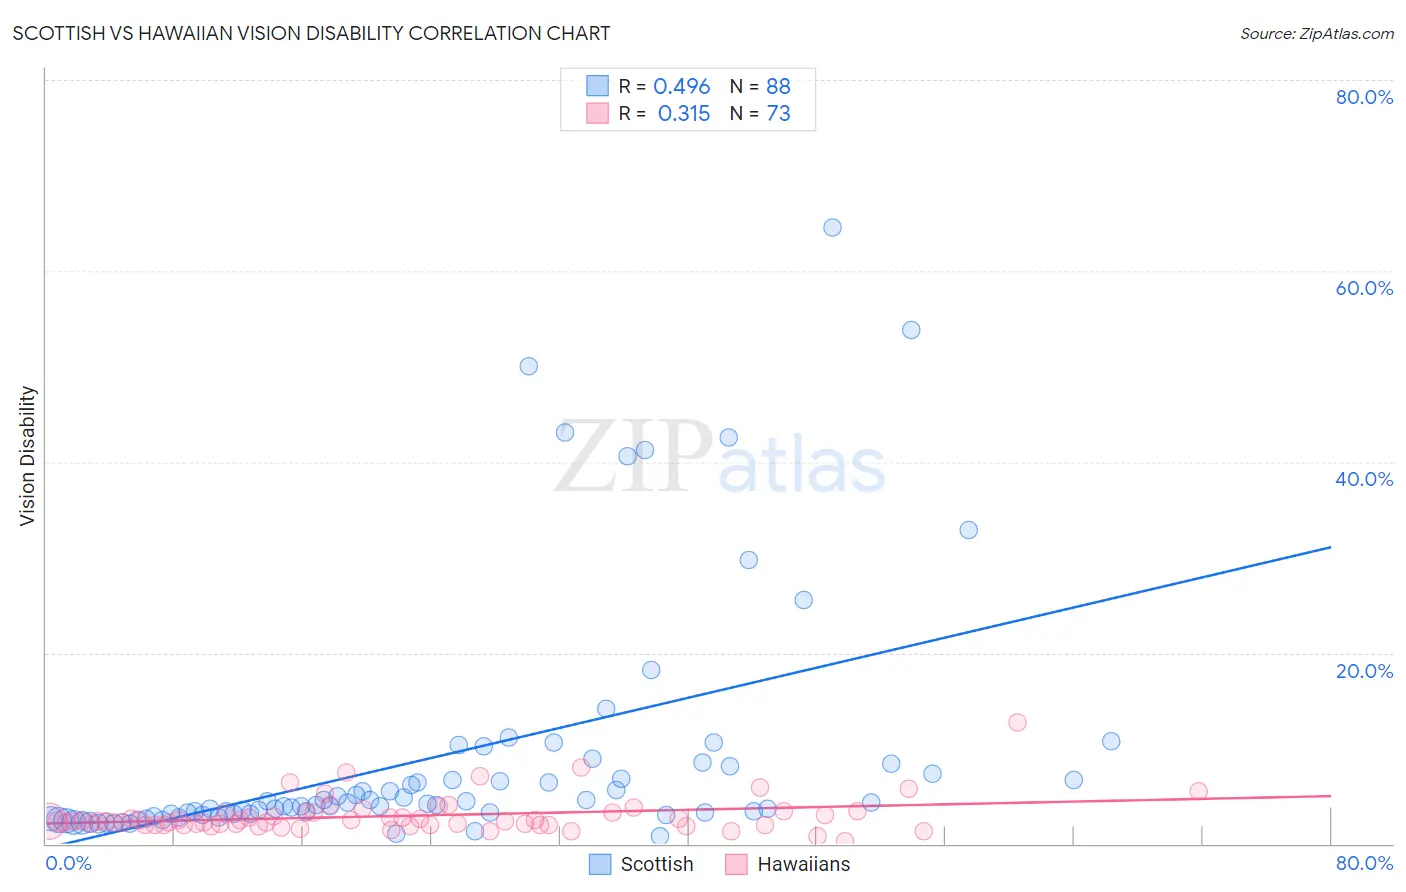
Scottish vs Hawaiian Vision Disability Correlation Chart
The statistical analysis conducted on geographies consisting of 565,142,315 people shows a moderate positive correlation between the proportion of Scottish and percentage of population with vision disability in the United States with a correlation coefficient (R) of 0.496 and weighted average of 2.3%. Similarly, the statistical analysis conducted on geographies consisting of 327,342,922 people shows a mild positive correlation between the proportion of Hawaiians and percentage of population with vision disability in the United States with a correlation coefficient (R) of 0.315 and weighted average of 2.3%, a difference of 0.94%.
Vision Disability Correlation Summary
| Measurement | Scottish | Hawaiian |
| Minimum | 0.83% | 0.26% |
| Maximum | 64.6% | 12.7% |
| Range | 63.8% | 12.4% |
| Mean | 9.1% | 2.9% |
| Median | 4.1% | 2.3% |
| Interquartile 25% (IQ1) | 3.0% | 2.0% |
| Interquartile 75% (IQ3) | 7.7% | 3.2% |
| Interquartile Range (IQR) | 4.7% | 1.3% |
| Standard Deviation (Sample) | 12.9% | 1.9% |
| Standard Deviation (Population) | 12.8% | 1.9% |
Demographics Similar to Scottish and Hawaiians by Vision Disability
In terms of vision disability, the demographic groups most similar to Scottish are Marshallese (2.3%, a difference of 0.070%), Immigrants from Congo (2.3%, a difference of 0.16%), Central American (2.3%, a difference of 0.18%), German Russian (2.3%, a difference of 0.20%), and Immigrants from Portugal (2.3%, a difference of 0.21%). Similarly, the demographic groups most similar to Hawaiians are Immigrants from Germany (2.3%, a difference of 0.050%), Hmong (2.3%, a difference of 0.24%), Immigrants from Western Africa (2.3%, a difference of 0.27%), Irish (2.3%, a difference of 0.28%), and Basque (2.3%, a difference of 0.31%).
| Demographics | Rating | Rank | Vision Disability |
| Guamanians/Chamorros | 3.9 /100 | #220 | Tragic 2.3% |
| French Canadians | 3.9 /100 | #221 | Tragic 2.3% |
| Immigrants | Senegal | 3.8 /100 | #222 | Tragic 2.3% |
| Basques | 3.5 /100 | #223 | Tragic 2.3% |
| Irish | 3.4 /100 | #224 | Tragic 2.3% |
| Immigrants | Western Africa | 3.4 /100 | #225 | Tragic 2.3% |
| Immigrants | Germany | 3.0 /100 | #226 | Tragic 2.3% |
| Hawaiians | 2.9 /100 | #227 | Tragic 2.3% |
| Hmong | 2.5 /100 | #228 | Tragic 2.3% |
| Welsh | 2.3 /100 | #229 | Tragic 2.3% |
| Nicaraguans | 2.2 /100 | #230 | Tragic 2.3% |
| Immigrants | Ecuador | 2.0 /100 | #231 | Tragic 2.3% |
| German Russians | 1.8 /100 | #232 | Tragic 2.3% |
| Central Americans | 1.8 /100 | #233 | Tragic 2.3% |
| Scottish | 1.6 /100 | #234 | Tragic 2.3% |
| Marshallese | 1.5 /100 | #235 | Tragic 2.3% |
| Immigrants | Congo | 1.4 /100 | #236 | Tragic 2.3% |
| Immigrants | Portugal | 1.4 /100 | #237 | Tragic 2.3% |
| Immigrants | Cambodia | 1.1 /100 | #238 | Tragic 2.3% |
| English | 1.1 /100 | #239 | Tragic 2.3% |
| Panamanians | 0.9 /100 | #240 | Tragic 2.3% |