Immigrants from Europe vs Immigrants from Scotland Vision Disability
COMPARE
Immigrants from Europe
Immigrants from Scotland
Vision Disability
Vision Disability Comparison
Immigrants from Europe
Immigrants from Scotland
2.1%
VISION DISABILITY
96.1/ 100
METRIC RATING
93rd/ 347
METRIC RANK
2.1%
VISION DISABILITY
90.4/ 100
METRIC RATING
121st/ 347
METRIC RANK
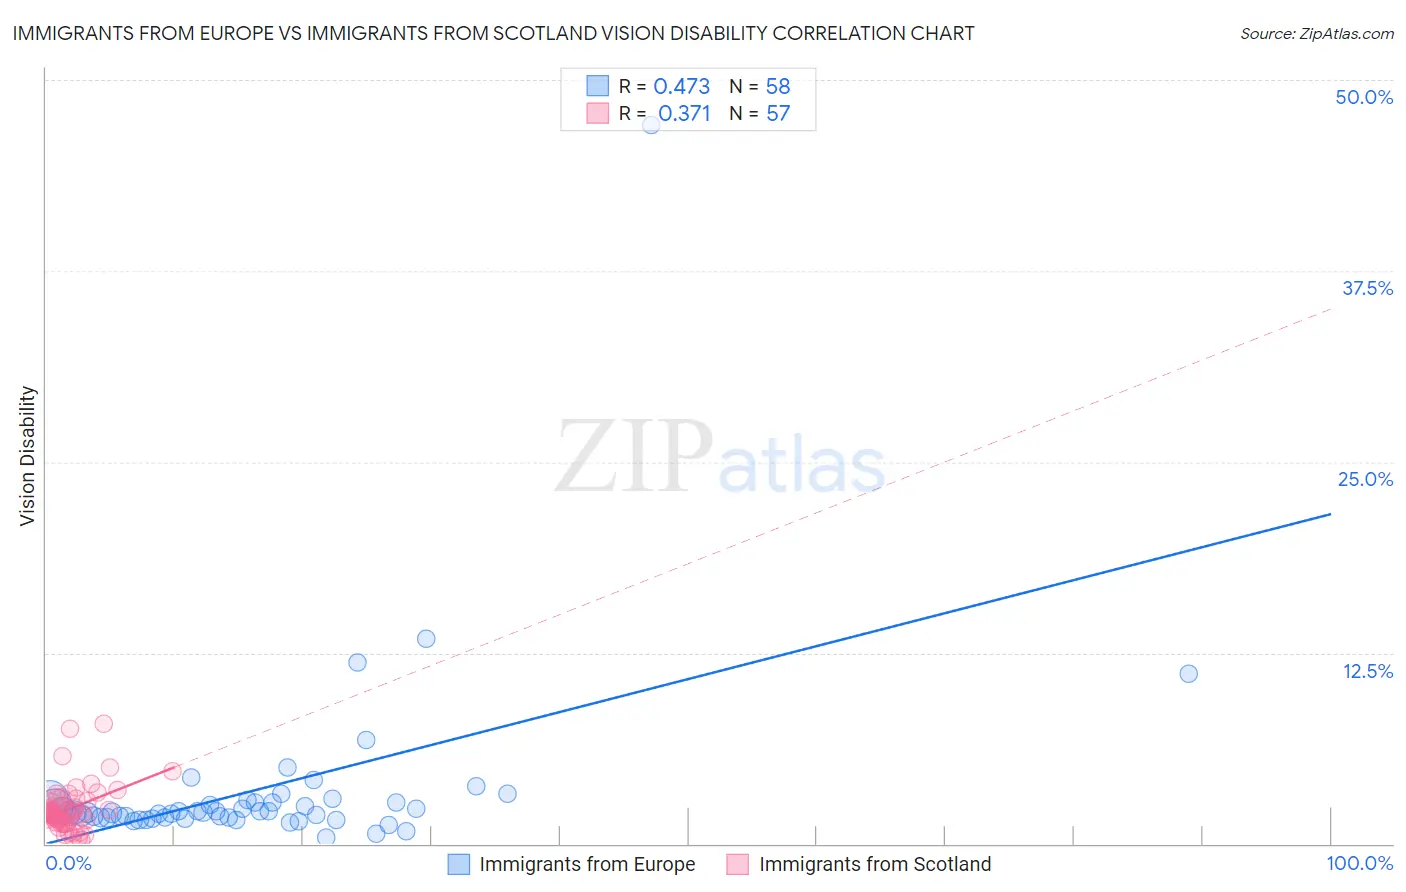
Immigrants from Europe vs Immigrants from Scotland Vision Disability Correlation Chart
The statistical analysis conducted on geographies consisting of 546,008,895 people shows a moderate positive correlation between the proportion of Immigrants from Europe and percentage of population with vision disability in the United States with a correlation coefficient (R) of 0.473 and weighted average of 2.1%. Similarly, the statistical analysis conducted on geographies consisting of 196,324,297 people shows a mild positive correlation between the proportion of Immigrants from Scotland and percentage of population with vision disability in the United States with a correlation coefficient (R) of 0.371 and weighted average of 2.1%, a difference of 1.6%.
Vision Disability Correlation Summary
| Measurement | Immigrants from Europe | Immigrants from Scotland |
| Minimum | 0.41% | 0.21% |
| Maximum | 47.1% | 7.9% |
| Range | 46.7% | 7.7% |
| Mean | 3.5% | 2.3% |
| Median | 2.1% | 2.0% |
| Interquartile 25% (IQ1) | 1.7% | 1.4% |
| Interquartile 75% (IQ3) | 2.7% | 2.8% |
| Interquartile Range (IQR) | 1.0% | 1.4% |
| Standard Deviation (Sample) | 6.3% | 1.5% |
| Standard Deviation (Population) | 6.3% | 1.5% |
Similar Demographics by Vision Disability
Demographics Similar to Immigrants from Europe by Vision Disability
In terms of vision disability, the demographic groups most similar to Immigrants from Europe are Immigrants from Croatia (2.1%, a difference of 0.020%), Immigrants from Syria (2.1%, a difference of 0.050%), Immigrants from Somalia (2.1%, a difference of 0.060%), Australian (2.1%, a difference of 0.090%), and Romanian (2.1%, a difference of 0.15%).
| Demographics | Rating | Rank | Vision Disability |
| Immigrants | Moldova | 97.2 /100 | #86 | Exceptional 2.0% |
| Immigrants | Switzerland | 97.0 /100 | #87 | Exceptional 2.0% |
| Norwegians | 97.0 /100 | #88 | Exceptional 2.0% |
| Immigrants | Eastern Africa | 97.0 /100 | #89 | Exceptional 2.0% |
| Immigrants | Lebanon | 96.7 /100 | #90 | Exceptional 2.1% |
| Immigrants | Somalia | 96.2 /100 | #91 | Exceptional 2.1% |
| Immigrants | Syria | 96.2 /100 | #92 | Exceptional 2.1% |
| Immigrants | Europe | 96.1 /100 | #93 | Exceptional 2.1% |
| Immigrants | Croatia | 96.0 /100 | #94 | Exceptional 2.1% |
| Australians | 95.9 /100 | #95 | Exceptional 2.1% |
| Romanians | 95.7 /100 | #96 | Exceptional 2.1% |
| Immigrants | Afghanistan | 95.6 /100 | #97 | Exceptional 2.1% |
| Immigrants | South Africa | 95.4 /100 | #98 | Exceptional 2.1% |
| Estonians | 95.3 /100 | #99 | Exceptional 2.1% |
| Greeks | 95.1 /100 | #100 | Exceptional 2.1% |
Demographics Similar to Immigrants from Scotland by Vision Disability
In terms of vision disability, the demographic groups most similar to Immigrants from Scotland are Immigrants from Ukraine (2.1%, a difference of 0.010%), Immigrants from Albania (2.1%, a difference of 0.010%), Immigrants from Spain (2.1%, a difference of 0.11%), Immigrants from Zimbabwe (2.1%, a difference of 0.12%), and Immigrants from Venezuela (2.1%, a difference of 0.12%).
| Demographics | Rating | Rank | Vision Disability |
| Croatians | 92.3 /100 | #114 | Exceptional 2.1% |
| Immigrants | Vietnam | 92.2 /100 | #115 | Exceptional 2.1% |
| Ugandans | 92.2 /100 | #116 | Exceptional 2.1% |
| Poles | 92.0 /100 | #117 | Exceptional 2.1% |
| Immigrants | Philippines | 91.4 /100 | #118 | Exceptional 2.1% |
| Immigrants | Uganda | 91.4 /100 | #119 | Exceptional 2.1% |
| Immigrants | Zimbabwe | 91.0 /100 | #120 | Exceptional 2.1% |
| Immigrants | Scotland | 90.4 /100 | #121 | Exceptional 2.1% |
| Immigrants | Ukraine | 90.4 /100 | #122 | Exceptional 2.1% |
| Immigrants | Albania | 90.4 /100 | #123 | Exceptional 2.1% |
| Immigrants | Spain | 89.8 /100 | #124 | Excellent 2.1% |
| Immigrants | Venezuela | 89.8 /100 | #125 | Excellent 2.1% |
| Immigrants | Peru | 89.5 /100 | #126 | Excellent 2.1% |
| Sudanese | 89.2 /100 | #127 | Excellent 2.1% |
| Immigrants | Chile | 89.0 /100 | #128 | Excellent 2.1% |