Basque vs Immigrants from Panama Vision Disability
COMPARE
Basque
Immigrants from Panama
Vision Disability
Vision Disability Comparison
Basques
Immigrants from Panama
2.3%
VISION DISABILITY
3.5/ 100
METRIC RATING
223rd/ 347
METRIC RANK
2.3%
VISION DISABILITY
0.8/ 100
METRIC RATING
242nd/ 347
METRIC RANK
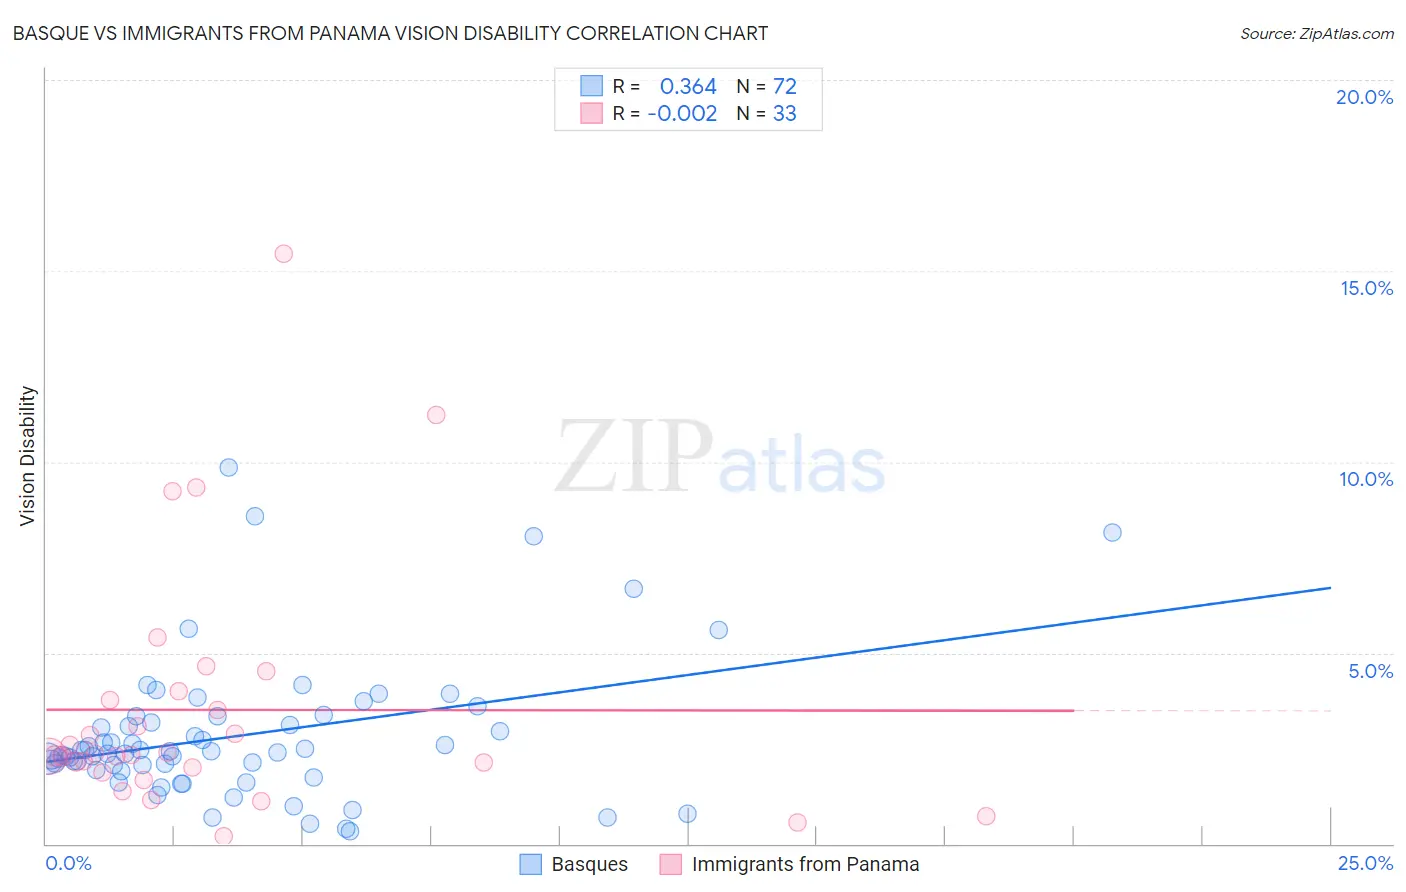
Basque vs Immigrants from Panama Vision Disability Correlation Chart
The statistical analysis conducted on geographies consisting of 165,747,167 people shows a mild positive correlation between the proportion of Basques and percentage of population with vision disability in the United States with a correlation coefficient (R) of 0.364 and weighted average of 2.3%. Similarly, the statistical analysis conducted on geographies consisting of 221,144,457 people shows no correlation between the proportion of Immigrants from Panama and percentage of population with vision disability in the United States with a correlation coefficient (R) of -0.002 and weighted average of 2.3%, a difference of 2.2%.
Vision Disability Correlation Summary
| Measurement | Basque | Immigrants from Panama |
| Minimum | 0.32% | 0.19% |
| Maximum | 9.8% | 15.5% |
| Range | 9.5% | 15.3% |
| Mean | 2.8% | 3.5% |
| Median | 2.4% | 2.3% |
| Interquartile 25% (IQ1) | 2.0% | 1.9% |
| Interquartile 75% (IQ3) | 3.2% | 3.9% |
| Interquartile Range (IQR) | 1.3% | 1.9% |
| Standard Deviation (Sample) | 1.8% | 3.3% |
| Standard Deviation (Population) | 1.8% | 3.2% |
Demographics Similar to Basques and Immigrants from Panama by Vision Disability
In terms of vision disability, the demographic groups most similar to Basques are Irish (2.3%, a difference of 0.020%), Immigrants from Western Africa (2.3%, a difference of 0.040%), Immigrants from Senegal (2.3%, a difference of 0.14%), Immigrants from Germany (2.3%, a difference of 0.26%), and Hawaiian (2.3%, a difference of 0.31%). Similarly, the demographic groups most similar to Immigrants from Panama are Malaysian (2.3%, a difference of 0.14%), Panamanian (2.3%, a difference of 0.18%), English (2.3%, a difference of 0.43%), Immigrants from Cambodia (2.3%, a difference of 0.45%), and Immigrants from Portugal (2.3%, a difference of 0.72%).
| Demographics | Rating | Rank | Vision Disability |
| Immigrants | Senegal | 3.8 /100 | #222 | Tragic 2.3% |
| Basques | 3.5 /100 | #223 | Tragic 2.3% |
| Irish | 3.4 /100 | #224 | Tragic 2.3% |
| Immigrants | Western Africa | 3.4 /100 | #225 | Tragic 2.3% |
| Immigrants | Germany | 3.0 /100 | #226 | Tragic 2.3% |
| Hawaiians | 2.9 /100 | #227 | Tragic 2.3% |
| Hmong | 2.5 /100 | #228 | Tragic 2.3% |
| Welsh | 2.3 /100 | #229 | Tragic 2.3% |
| Nicaraguans | 2.2 /100 | #230 | Tragic 2.3% |
| Immigrants | Ecuador | 2.0 /100 | #231 | Tragic 2.3% |
| German Russians | 1.8 /100 | #232 | Tragic 2.3% |
| Central Americans | 1.8 /100 | #233 | Tragic 2.3% |
| Scottish | 1.6 /100 | #234 | Tragic 2.3% |
| Marshallese | 1.5 /100 | #235 | Tragic 2.3% |
| Immigrants | Congo | 1.4 /100 | #236 | Tragic 2.3% |
| Immigrants | Portugal | 1.4 /100 | #237 | Tragic 2.3% |
| Immigrants | Cambodia | 1.1 /100 | #238 | Tragic 2.3% |
| English | 1.1 /100 | #239 | Tragic 2.3% |
| Panamanians | 0.9 /100 | #240 | Tragic 2.3% |
| Malaysians | 0.9 /100 | #241 | Tragic 2.3% |
| Immigrants | Panama | 0.8 /100 | #242 | Tragic 2.3% |