Crow vs Immigrants from Asia Vision Disability
COMPARE
Crow
Immigrants from Asia
Vision Disability
Vision Disability Comparison
Crow
Immigrants from Asia
2.5%
VISION DISABILITY
0.0/ 100
METRIC RATING
292nd/ 347
METRIC RANK
1.9%
VISION DISABILITY
99.9/ 100
METRIC RATING
23rd/ 347
METRIC RANK
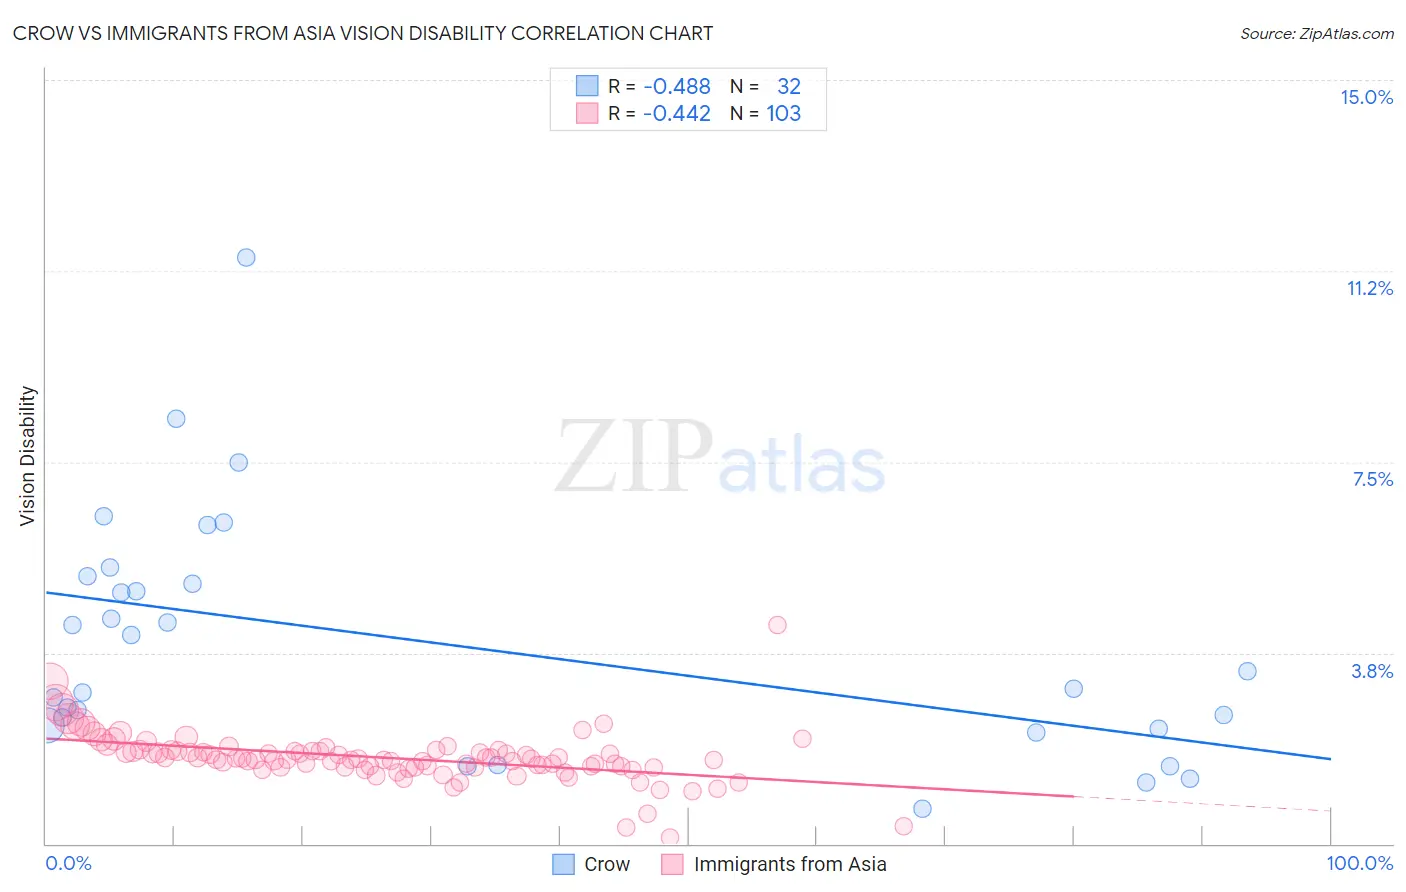
Crow vs Immigrants from Asia Vision Disability Correlation Chart
The statistical analysis conducted on geographies consisting of 59,186,790 people shows a moderate negative correlation between the proportion of Crow and percentage of population with vision disability in the United States with a correlation coefficient (R) of -0.488 and weighted average of 2.5%. Similarly, the statistical analysis conducted on geographies consisting of 547,864,164 people shows a moderate negative correlation between the proportion of Immigrants from Asia and percentage of population with vision disability in the United States with a correlation coefficient (R) of -0.442 and weighted average of 1.9%, a difference of 30.1%.
Vision Disability Correlation Summary
| Measurement | Crow | Immigrants from Asia |
| Minimum | 0.69% | 0.11% |
| Maximum | 11.5% | 4.3% |
| Range | 10.8% | 4.2% |
| Mean | 3.9% | 1.7% |
| Median | 3.2% | 1.7% |
| Interquartile 25% (IQ1) | 2.3% | 1.5% |
| Interquartile 75% (IQ3) | 5.2% | 1.8% |
| Interquartile Range (IQR) | 2.9% | 0.32% |
| Standard Deviation (Sample) | 2.4% | 0.51% |
| Standard Deviation (Population) | 2.3% | 0.51% |
Similar Demographics by Vision Disability
Demographics Similar to Crow by Vision Disability
In terms of vision disability, the demographic groups most similar to Crow are Yaqui (2.5%, a difference of 0.030%), Immigrants from Honduras (2.5%, a difference of 0.10%), Ottawa (2.5%, a difference of 0.36%), Immigrants from Cuba (2.5%, a difference of 0.49%), and Delaware (2.5%, a difference of 0.58%).
| Demographics | Rating | Rank | Vision Disability |
| Immigrants | Central America | 0.0 /100 | #285 | Tragic 2.5% |
| Sioux | 0.0 /100 | #286 | Tragic 2.5% |
| Hondurans | 0.0 /100 | #287 | Tragic 2.5% |
| French American Indians | 0.0 /100 | #288 | Tragic 2.5% |
| Immigrants | Nonimmigrants | 0.0 /100 | #289 | Tragic 2.5% |
| Immigrants | Cuba | 0.0 /100 | #290 | Tragic 2.5% |
| Immigrants | Honduras | 0.0 /100 | #291 | Tragic 2.5% |
| Crow | 0.0 /100 | #292 | Tragic 2.5% |
| Yaqui | 0.0 /100 | #293 | Tragic 2.5% |
| Ottawa | 0.0 /100 | #294 | Tragic 2.5% |
| Delaware | 0.0 /100 | #295 | Tragic 2.5% |
| Immigrants | Mexico | 0.0 /100 | #296 | Tragic 2.5% |
| Immigrants | Dominica | 0.0 /100 | #297 | Tragic 2.5% |
| Mexicans | 0.0 /100 | #298 | Tragic 2.5% |
| Cree | 0.0 /100 | #299 | Tragic 2.5% |
Demographics Similar to Immigrants from Asia by Vision Disability
In terms of vision disability, the demographic groups most similar to Immigrants from Asia are Immigrants from Lithuania (1.9%, a difference of 0.12%), Bulgarian (1.9%, a difference of 0.16%), Immigrants from Japan (1.9%, a difference of 0.20%), Immigrants from Pakistan (1.9%, a difference of 0.54%), and Taiwanese (1.9%, a difference of 0.54%).
| Demographics | Rating | Rank | Vision Disability |
| Indians (Asian) | 100.0 /100 | #16 | Exceptional 1.8% |
| Burmese | 100.0 /100 | #17 | Exceptional 1.8% |
| Bolivians | 100.0 /100 | #18 | Exceptional 1.9% |
| Immigrants | Sri Lanka | 100.0 /100 | #19 | Exceptional 1.9% |
| Asians | 100.0 /100 | #20 | Exceptional 1.9% |
| Turks | 100.0 /100 | #21 | Exceptional 1.9% |
| Immigrants | Pakistan | 100.0 /100 | #22 | Exceptional 1.9% |
| Immigrants | Asia | 99.9 /100 | #23 | Exceptional 1.9% |
| Immigrants | Lithuania | 99.9 /100 | #24 | Exceptional 1.9% |
| Bulgarians | 99.9 /100 | #25 | Exceptional 1.9% |
| Immigrants | Japan | 99.9 /100 | #26 | Exceptional 1.9% |
| Taiwanese | 99.9 /100 | #27 | Exceptional 1.9% |
| Immigrants | Malaysia | 99.9 /100 | #28 | Exceptional 1.9% |
| Egyptians | 99.9 /100 | #29 | Exceptional 1.9% |
| Immigrants | Nepal | 99.9 /100 | #30 | Exceptional 1.9% |