Filipino vs Immigrants from Asia Vision Disability
COMPARE
Filipino
Immigrants from Asia
Vision Disability
Vision Disability Comparison
Filipinos
Immigrants from Asia
1.7%
VISION DISABILITY
100.0/ 100
METRIC RATING
2nd/ 347
METRIC RANK
1.9%
VISION DISABILITY
99.9/ 100
METRIC RATING
23rd/ 347
METRIC RANK
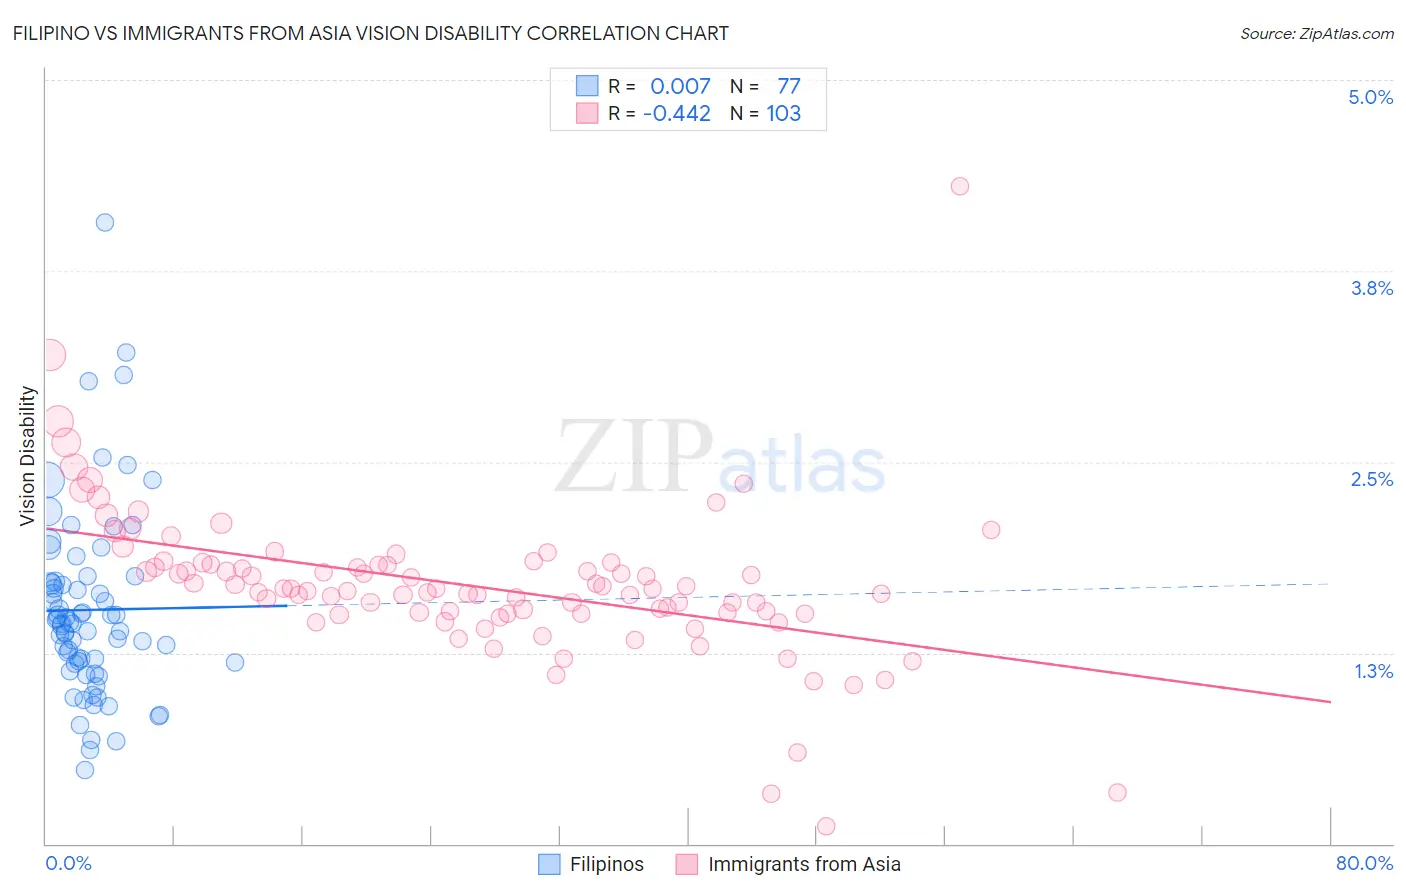
Filipino vs Immigrants from Asia Vision Disability Correlation Chart
The statistical analysis conducted on geographies consisting of 254,226,053 people shows no correlation between the proportion of Filipinos and percentage of population with vision disability in the United States with a correlation coefficient (R) of 0.007 and weighted average of 1.7%. Similarly, the statistical analysis conducted on geographies consisting of 547,864,164 people shows a moderate negative correlation between the proportion of Immigrants from Asia and percentage of population with vision disability in the United States with a correlation coefficient (R) of -0.442 and weighted average of 1.9%, a difference of 13.8%.
Vision Disability Correlation Summary
| Measurement | Filipino | Immigrants from Asia |
| Minimum | 0.48% | 0.11% |
| Maximum | 4.1% | 4.3% |
| Range | 3.6% | 4.2% |
| Mean | 1.5% | 1.7% |
| Median | 1.4% | 1.7% |
| Interquartile 25% (IQ1) | 1.2% | 1.5% |
| Interquartile 75% (IQ3) | 1.7% | 1.8% |
| Interquartile Range (IQR) | 0.53% | 0.32% |
| Standard Deviation (Sample) | 0.61% | 0.51% |
| Standard Deviation (Population) | 0.61% | 0.51% |
Similar Demographics by Vision Disability
Demographics Similar to Filipinos by Vision Disability
In terms of vision disability, the demographic groups most similar to Filipinos are Immigrants from India (1.7%, a difference of 0.050%), Immigrants from Taiwan (1.7%, a difference of 0.65%), Thai (1.7%, a difference of 3.3%), Okinawan (1.8%, a difference of 5.3%), and Immigrants from Iran (1.8%, a difference of 5.9%).
| Demographics | Rating | Rank | Vision Disability |
| Immigrants | India | 100.0 /100 | #1 | Exceptional 1.7% |
| Filipinos | 100.0 /100 | #2 | Exceptional 1.7% |
| Immigrants | Taiwan | 100.0 /100 | #3 | Exceptional 1.7% |
| Thais | 100.0 /100 | #4 | Exceptional 1.7% |
| Okinawans | 100.0 /100 | #5 | Exceptional 1.8% |
| Immigrants | Iran | 100.0 /100 | #6 | Exceptional 1.8% |
| Immigrants | South Central Asia | 100.0 /100 | #7 | Exceptional 1.8% |
| Iranians | 100.0 /100 | #8 | Exceptional 1.8% |
| Immigrants | Singapore | 100.0 /100 | #9 | Exceptional 1.8% |
| Immigrants | Hong Kong | 100.0 /100 | #10 | Exceptional 1.8% |
| Immigrants | Israel | 100.0 /100 | #11 | Exceptional 1.8% |
| Immigrants | Korea | 100.0 /100 | #12 | Exceptional 1.8% |
| Immigrants | Eastern Asia | 100.0 /100 | #13 | Exceptional 1.8% |
| Immigrants | China | 100.0 /100 | #14 | Exceptional 1.8% |
| Immigrants | Bolivia | 100.0 /100 | #15 | Exceptional 1.8% |
Demographics Similar to Immigrants from Asia by Vision Disability
In terms of vision disability, the demographic groups most similar to Immigrants from Asia are Immigrants from Lithuania (1.9%, a difference of 0.12%), Bulgarian (1.9%, a difference of 0.16%), Immigrants from Japan (1.9%, a difference of 0.20%), Immigrants from Pakistan (1.9%, a difference of 0.54%), and Taiwanese (1.9%, a difference of 0.54%).
| Demographics | Rating | Rank | Vision Disability |
| Indians (Asian) | 100.0 /100 | #16 | Exceptional 1.8% |
| Burmese | 100.0 /100 | #17 | Exceptional 1.8% |
| Bolivians | 100.0 /100 | #18 | Exceptional 1.9% |
| Immigrants | Sri Lanka | 100.0 /100 | #19 | Exceptional 1.9% |
| Asians | 100.0 /100 | #20 | Exceptional 1.9% |
| Turks | 100.0 /100 | #21 | Exceptional 1.9% |
| Immigrants | Pakistan | 100.0 /100 | #22 | Exceptional 1.9% |
| Immigrants | Asia | 99.9 /100 | #23 | Exceptional 1.9% |
| Immigrants | Lithuania | 99.9 /100 | #24 | Exceptional 1.9% |
| Bulgarians | 99.9 /100 | #25 | Exceptional 1.9% |
| Immigrants | Japan | 99.9 /100 | #26 | Exceptional 1.9% |
| Taiwanese | 99.9 /100 | #27 | Exceptional 1.9% |
| Immigrants | Malaysia | 99.9 /100 | #28 | Exceptional 1.9% |
| Egyptians | 99.9 /100 | #29 | Exceptional 1.9% |
| Immigrants | Nepal | 99.9 /100 | #30 | Exceptional 1.9% |