Austrian vs Immigrants from Asia Vision Disability
COMPARE
Austrian
Immigrants from Asia
Vision Disability
Vision Disability Comparison
Austrians
Immigrants from Asia
2.1%
VISION DISABILITY
69.0/ 100
METRIC RATING
160th/ 347
METRIC RANK
1.9%
VISION DISABILITY
99.9/ 100
METRIC RATING
23rd/ 347
METRIC RANK
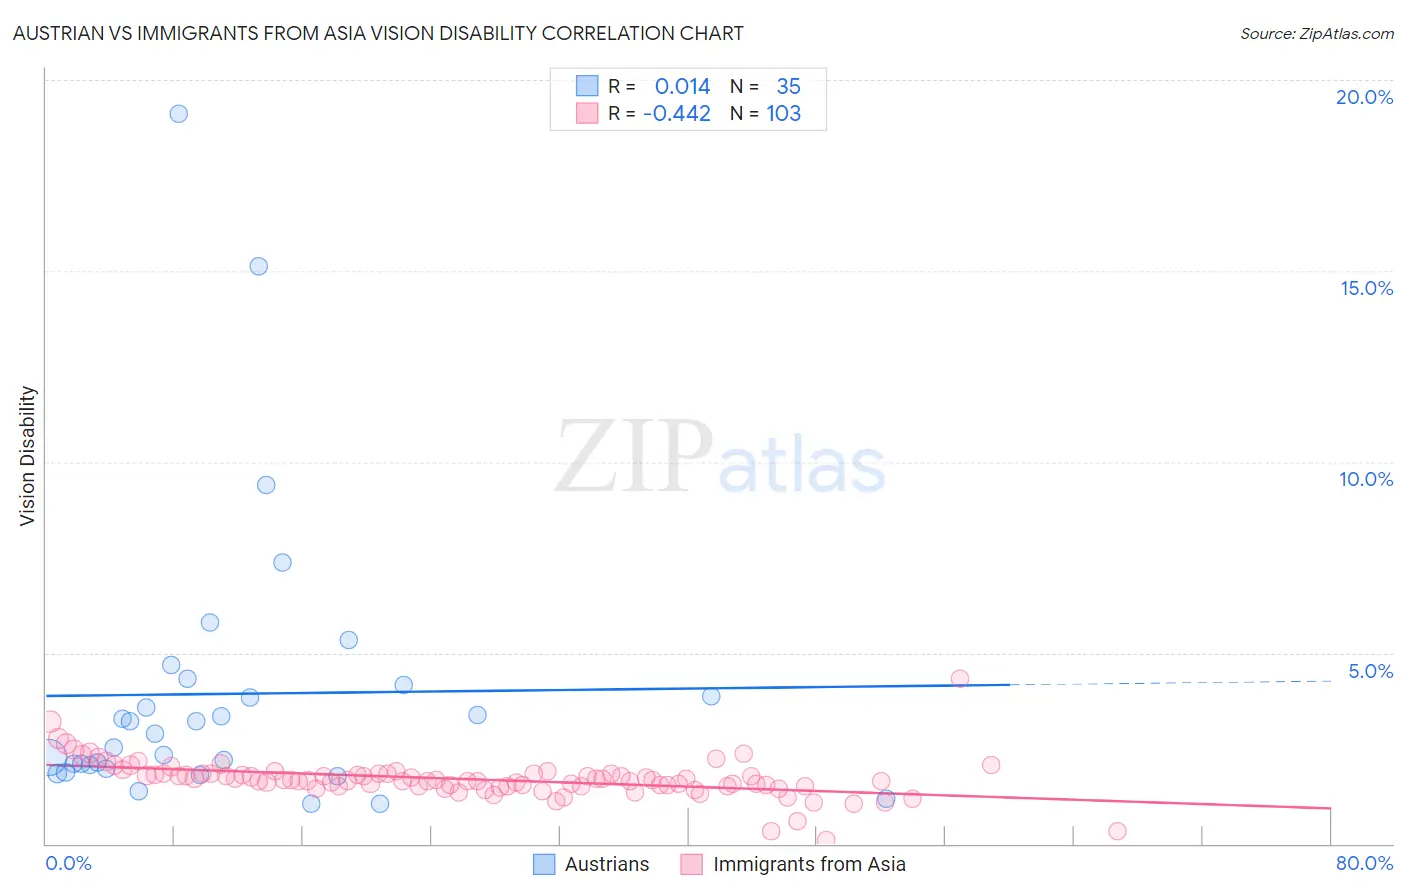
Austrian vs Immigrants from Asia Vision Disability Correlation Chart
The statistical analysis conducted on geographies consisting of 451,572,198 people shows no correlation between the proportion of Austrians and percentage of population with vision disability in the United States with a correlation coefficient (R) of 0.014 and weighted average of 2.1%. Similarly, the statistical analysis conducted on geographies consisting of 547,864,164 people shows a moderate negative correlation between the proportion of Immigrants from Asia and percentage of population with vision disability in the United States with a correlation coefficient (R) of -0.442 and weighted average of 1.9%, a difference of 11.6%.
Vision Disability Correlation Summary
| Measurement | Austrian | Immigrants from Asia |
| Minimum | 1.0% | 0.11% |
| Maximum | 19.1% | 4.3% |
| Range | 18.1% | 4.2% |
| Mean | 3.9% | 1.7% |
| Median | 2.9% | 1.7% |
| Interquartile 25% (IQ1) | 2.0% | 1.5% |
| Interquartile 75% (IQ3) | 4.2% | 1.8% |
| Interquartile Range (IQR) | 2.2% | 0.32% |
| Standard Deviation (Sample) | 3.8% | 0.51% |
| Standard Deviation (Population) | 3.7% | 0.51% |
Similar Demographics by Vision Disability
Demographics Similar to Austrians by Vision Disability
In terms of vision disability, the demographic groups most similar to Austrians are South African (2.1%, a difference of 0.060%), Immigrants from Uzbekistan (2.1%, a difference of 0.070%), Serbian (2.1%, a difference of 0.090%), Iraqi (2.1%, a difference of 0.090%), and Hungarian (2.1%, a difference of 0.12%).
| Demographics | Rating | Rank | Vision Disability |
| Immigrants | South America | 73.8 /100 | #153 | Good 2.1% |
| Slovenes | 73.6 /100 | #154 | Good 2.1% |
| Immigrants | Colombia | 72.1 /100 | #155 | Good 2.1% |
| Pakistanis | 71.6 /100 | #156 | Good 2.1% |
| Serbians | 70.2 /100 | #157 | Good 2.1% |
| Immigrants | Uzbekistan | 69.9 /100 | #158 | Good 2.1% |
| South Africans | 69.8 /100 | #159 | Good 2.1% |
| Austrians | 69.0 /100 | #160 | Good 2.1% |
| Iraqis | 67.7 /100 | #161 | Good 2.1% |
| Hungarians | 67.4 /100 | #162 | Good 2.1% |
| Icelanders | 66.1 /100 | #163 | Good 2.1% |
| Immigrants | Bangladesh | 65.5 /100 | #164 | Good 2.1% |
| Immigrants | Iraq | 64.8 /100 | #165 | Good 2.1% |
| Immigrants | England | 62.8 /100 | #166 | Good 2.1% |
| Immigrants | Africa | 62.6 /100 | #167 | Good 2.1% |
Demographics Similar to Immigrants from Asia by Vision Disability
In terms of vision disability, the demographic groups most similar to Immigrants from Asia are Immigrants from Lithuania (1.9%, a difference of 0.12%), Bulgarian (1.9%, a difference of 0.16%), Immigrants from Japan (1.9%, a difference of 0.20%), Immigrants from Pakistan (1.9%, a difference of 0.54%), and Taiwanese (1.9%, a difference of 0.54%).
| Demographics | Rating | Rank | Vision Disability |
| Indians (Asian) | 100.0 /100 | #16 | Exceptional 1.8% |
| Burmese | 100.0 /100 | #17 | Exceptional 1.8% |
| Bolivians | 100.0 /100 | #18 | Exceptional 1.9% |
| Immigrants | Sri Lanka | 100.0 /100 | #19 | Exceptional 1.9% |
| Asians | 100.0 /100 | #20 | Exceptional 1.9% |
| Turks | 100.0 /100 | #21 | Exceptional 1.9% |
| Immigrants | Pakistan | 100.0 /100 | #22 | Exceptional 1.9% |
| Immigrants | Asia | 99.9 /100 | #23 | Exceptional 1.9% |
| Immigrants | Lithuania | 99.9 /100 | #24 | Exceptional 1.9% |
| Bulgarians | 99.9 /100 | #25 | Exceptional 1.9% |
| Immigrants | Japan | 99.9 /100 | #26 | Exceptional 1.9% |
| Taiwanese | 99.9 /100 | #27 | Exceptional 1.9% |
| Immigrants | Malaysia | 99.9 /100 | #28 | Exceptional 1.9% |
| Egyptians | 99.9 /100 | #29 | Exceptional 1.9% |
| Immigrants | Nepal | 99.9 /100 | #30 | Exceptional 1.9% |