Immigrants from Jamaica vs Alaska Native Female Disability
COMPARE
Immigrants from Jamaica
Alaska Native
Female Disability
Female Disability Comparison
Immigrants from Jamaica
Alaska Natives
12.6%
FEMALE DISABILITY
2.2/ 100
METRIC RATING
245th/ 347
METRIC RANK
12.8%
FEMALE DISABILITY
0.6/ 100
METRIC RATING
264th/ 347
METRIC RANK
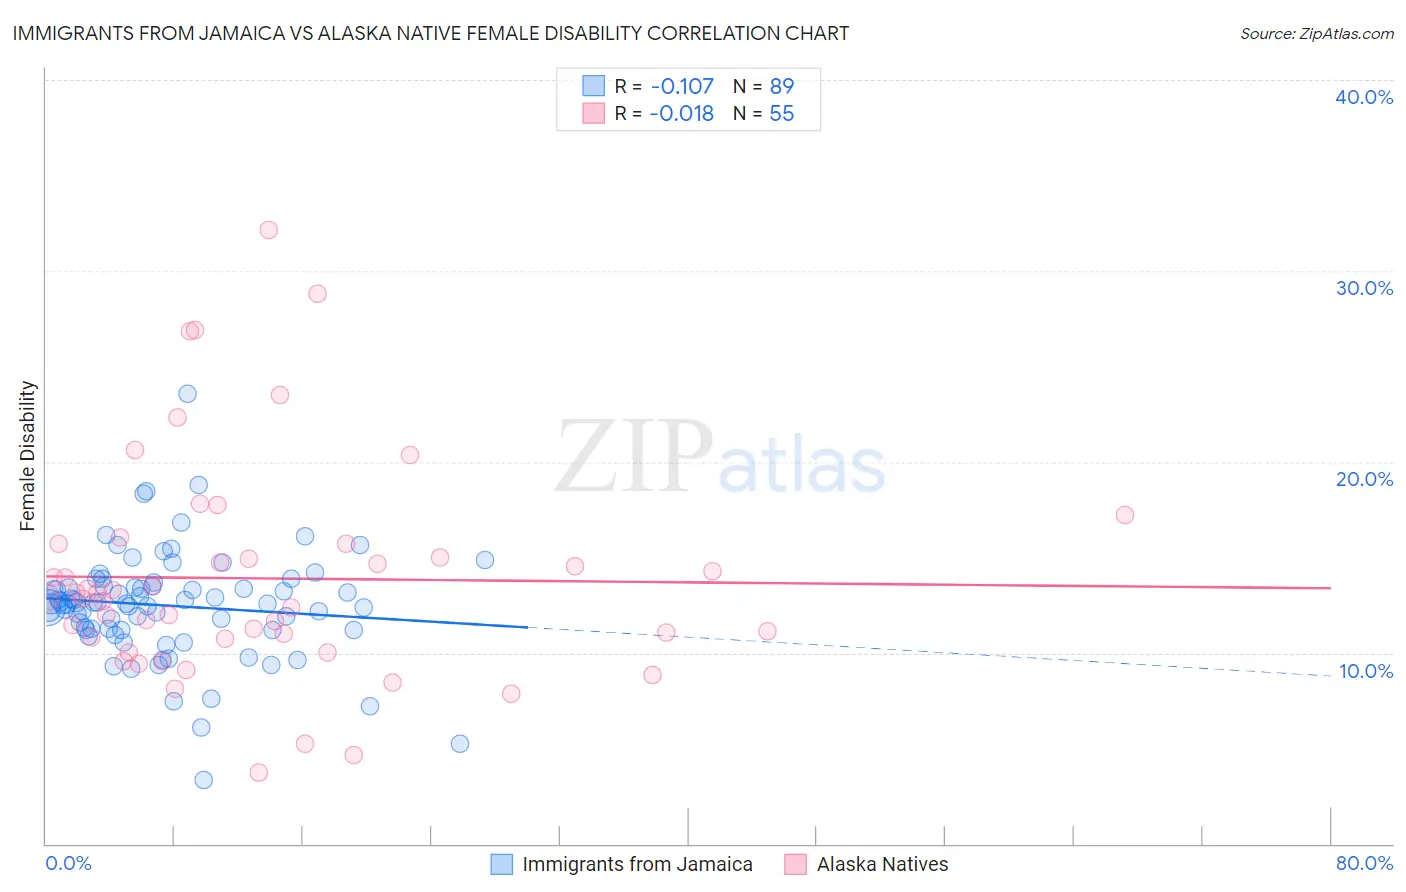
Immigrants from Jamaica vs Alaska Native Female Disability Correlation Chart
The statistical analysis conducted on geographies consisting of 301,727,948 people shows a poor negative correlation between the proportion of Immigrants from Jamaica and percentage of females with a disability in the United States with a correlation coefficient (R) of -0.107 and weighted average of 12.6%. Similarly, the statistical analysis conducted on geographies consisting of 76,769,198 people shows no correlation between the proportion of Alaska Natives and percentage of females with a disability in the United States with a correlation coefficient (R) of -0.018 and weighted average of 12.8%, a difference of 1.2%.
Female Disability Correlation Summary
| Measurement | Immigrants from Jamaica | Alaska Native |
| Minimum | 3.3% | 3.8% |
| Maximum | 23.6% | 32.1% |
| Range | 20.2% | 28.4% |
| Mean | 12.5% | 13.9% |
| Median | 12.6% | 12.9% |
| Interquartile 25% (IQ1) | 11.2% | 10.7% |
| Interquartile 75% (IQ3) | 13.5% | 15.7% |
| Interquartile Range (IQR) | 2.3% | 5.0% |
| Standard Deviation (Sample) | 2.9% | 5.7% |
| Standard Deviation (Population) | 2.8% | 5.7% |
Demographics Similar to Immigrants from Jamaica and Alaska Natives by Female Disability
In terms of female disability, the demographic groups most similar to Immigrants from Jamaica are Spanish American Indian (12.6%, a difference of 0.020%), Menominee (12.6%, a difference of 0.030%), Carpatho Rusyn (12.6%, a difference of 0.070%), Alsatian (12.6%, a difference of 0.14%), and Immigrants from Congo (12.7%, a difference of 0.19%). Similarly, the demographic groups most similar to Alaska Natives are Spaniard (12.8%, a difference of 0.12%), Czechoslovakian (12.7%, a difference of 0.35%), Bermudan (12.7%, a difference of 0.41%), Subsaharan African (12.7%, a difference of 0.46%), and Immigrants from Armenia (12.7%, a difference of 0.47%).
| Demographics | Rating | Rank | Female Disability |
| Alsatians | 2.5 /100 | #244 | Tragic 12.6% |
| Immigrants | Jamaica | 2.2 /100 | #245 | Tragic 12.6% |
| Spanish American Indians | 2.1 /100 | #246 | Tragic 12.6% |
| Menominee | 2.1 /100 | #247 | Tragic 12.6% |
| Carpatho Rusyns | 2.0 /100 | #248 | Tragic 12.6% |
| Immigrants | Congo | 1.8 /100 | #249 | Tragic 12.7% |
| Slovenes | 1.7 /100 | #250 | Tragic 12.7% |
| Crow | 1.6 /100 | #251 | Tragic 12.7% |
| Immigrants | Caribbean | 1.4 /100 | #252 | Tragic 12.7% |
| Jamaicans | 1.4 /100 | #253 | Tragic 12.7% |
| Hawaiians | 1.4 /100 | #254 | Tragic 12.7% |
| Immigrants | Germany | 1.3 /100 | #255 | Tragic 12.7% |
| British West Indians | 1.2 /100 | #256 | Tragic 12.7% |
| Liberians | 1.1 /100 | #257 | Tragic 12.7% |
| Aleuts | 1.1 /100 | #258 | Tragic 12.7% |
| Immigrants | Armenia | 1.0 /100 | #259 | Tragic 12.7% |
| Sub-Saharan Africans | 1.0 /100 | #260 | Tragic 12.7% |
| Bermudans | 1.0 /100 | #261 | Tragic 12.7% |
| Czechoslovakians | 0.9 /100 | #262 | Tragic 12.7% |
| Spaniards | 0.7 /100 | #263 | Tragic 12.8% |
| Alaska Natives | 0.6 /100 | #264 | Tragic 12.8% |