Immigrants from Mexico vs Immigrants from Switzerland Female Disability
COMPARE
Immigrants from Mexico
Immigrants from Switzerland
Female Disability
Female Disability Comparison
Immigrants from Mexico
Immigrants from Switzerland
12.2%
FEMALE DISABILITY
50.8/ 100
METRIC RATING
173rd/ 347
METRIC RANK
11.5%
FEMALE DISABILITY
99.8/ 100
METRIC RATING
73rd/ 347
METRIC RANK
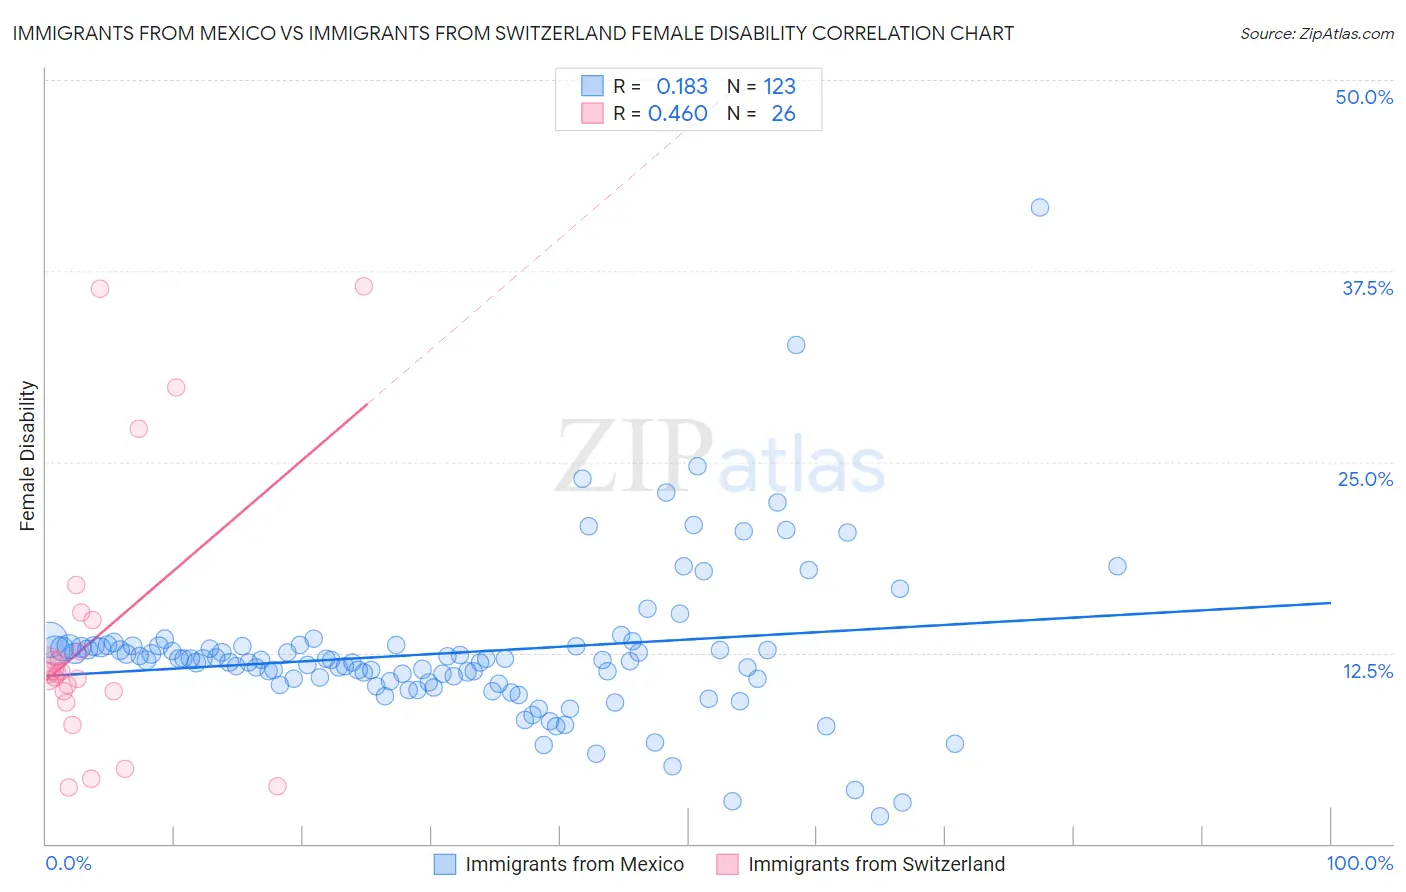
Immigrants from Mexico vs Immigrants from Switzerland Female Disability Correlation Chart
The statistical analysis conducted on geographies consisting of 513,519,603 people shows a poor positive correlation between the proportion of Immigrants from Mexico and percentage of females with a disability in the United States with a correlation coefficient (R) of 0.183 and weighted average of 12.2%. Similarly, the statistical analysis conducted on geographies consisting of 148,080,197 people shows a moderate positive correlation between the proportion of Immigrants from Switzerland and percentage of females with a disability in the United States with a correlation coefficient (R) of 0.460 and weighted average of 11.5%, a difference of 6.1%.
Female Disability Correlation Summary
| Measurement | Immigrants from Mexico | Immigrants from Switzerland |
| Minimum | 1.8% | 3.7% |
| Maximum | 41.7% | 36.5% |
| Range | 39.9% | 32.8% |
| Mean | 12.5% | 13.7% |
| Median | 12.1% | 11.2% |
| Interquartile 25% (IQ1) | 10.6% | 10.0% |
| Interquartile 75% (IQ3) | 12.9% | 14.6% |
| Interquartile Range (IQR) | 2.4% | 4.6% |
| Standard Deviation (Sample) | 5.0% | 8.9% |
| Standard Deviation (Population) | 5.0% | 8.8% |
Similar Demographics by Female Disability
Demographics Similar to Immigrants from Mexico by Female Disability
In terms of female disability, the demographic groups most similar to Immigrants from Mexico are Immigrants from England (12.2%, a difference of 0.030%), Haitian (12.2%, a difference of 0.040%), Immigrants from St. Vincent and the Grenadines (12.2%, a difference of 0.040%), Immigrants from Southern Europe (12.2%, a difference of 0.21%), and Maltese (12.2%, a difference of 0.23%).
| Demographics | Rating | Rank | Female Disability |
| Lithuanians | 59.5 /100 | #166 | Average 12.2% |
| Immigrants | Latin America | 59.0 /100 | #167 | Average 12.2% |
| Immigrants | Haiti | 58.8 /100 | #168 | Average 12.2% |
| Lebanese | 58.1 /100 | #169 | Average 12.2% |
| Maltese | 57.0 /100 | #170 | Average 12.2% |
| Immigrants | Southern Europe | 56.3 /100 | #171 | Average 12.2% |
| Haitians | 51.9 /100 | #172 | Average 12.2% |
| Immigrants | Mexico | 50.8 /100 | #173 | Average 12.2% |
| Immigrants | England | 50.0 /100 | #174 | Average 12.2% |
| Immigrants | St. Vincent and the Grenadines | 49.7 /100 | #175 | Average 12.2% |
| Immigrants | Guyana | 43.1 /100 | #176 | Average 12.2% |
| Immigrants | Ghana | 42.5 /100 | #177 | Average 12.2% |
| Immigrants | Western Europe | 40.9 /100 | #178 | Average 12.2% |
| Immigrants | Fiji | 38.2 /100 | #179 | Fair 12.3% |
| Albanians | 37.9 /100 | #180 | Fair 12.3% |
Demographics Similar to Immigrants from Switzerland by Female Disability
In terms of female disability, the demographic groups most similar to Immigrants from Switzerland are Chilean (11.5%, a difference of 0.020%), Immigrants from Ireland (11.5%, a difference of 0.080%), Bhutanese (11.5%, a difference of 0.080%), Immigrants from Chile (11.5%, a difference of 0.13%), and Colombian (11.5%, a difference of 0.14%).
| Demographics | Rating | Rank | Female Disability |
| Salvadorans | 99.8 /100 | #66 | Exceptional 11.5% |
| Immigrants | Vietnam | 99.8 /100 | #67 | Exceptional 11.5% |
| Immigrants | Northern Africa | 99.8 /100 | #68 | Exceptional 11.5% |
| Colombians | 99.8 /100 | #69 | Exceptional 11.5% |
| Immigrants | Chile | 99.8 /100 | #70 | Exceptional 11.5% |
| Immigrants | Ireland | 99.8 /100 | #71 | Exceptional 11.5% |
| Chileans | 99.8 /100 | #72 | Exceptional 11.5% |
| Immigrants | Switzerland | 99.8 /100 | #73 | Exceptional 11.5% |
| Bhutanese | 99.8 /100 | #74 | Exceptional 11.5% |
| Immigrants | Lebanon | 99.7 /100 | #75 | Exceptional 11.5% |
| Immigrants | Eritrea | 99.7 /100 | #76 | Exceptional 11.5% |
| Immigrants | Afghanistan | 99.7 /100 | #77 | Exceptional 11.5% |
| Immigrants | South Africa | 99.7 /100 | #78 | Exceptional 11.5% |
| Sierra Leoneans | 99.7 /100 | #79 | Exceptional 11.5% |
| Immigrants | Jordan | 99.7 /100 | #80 | Exceptional 11.5% |