Scotch-Irish vs Italian Ambulatory Disability
COMPARE
Scotch-Irish
Italian
Ambulatory Disability
Ambulatory Disability Comparison
Scotch-Irish
Italians
6.9%
AMBULATORY DISABILITY
0.0/ 100
METRIC RATING
290th/ 347
METRIC RANK
6.2%
AMBULATORY DISABILITY
22.6/ 100
METRIC RATING
199th/ 347
METRIC RANK
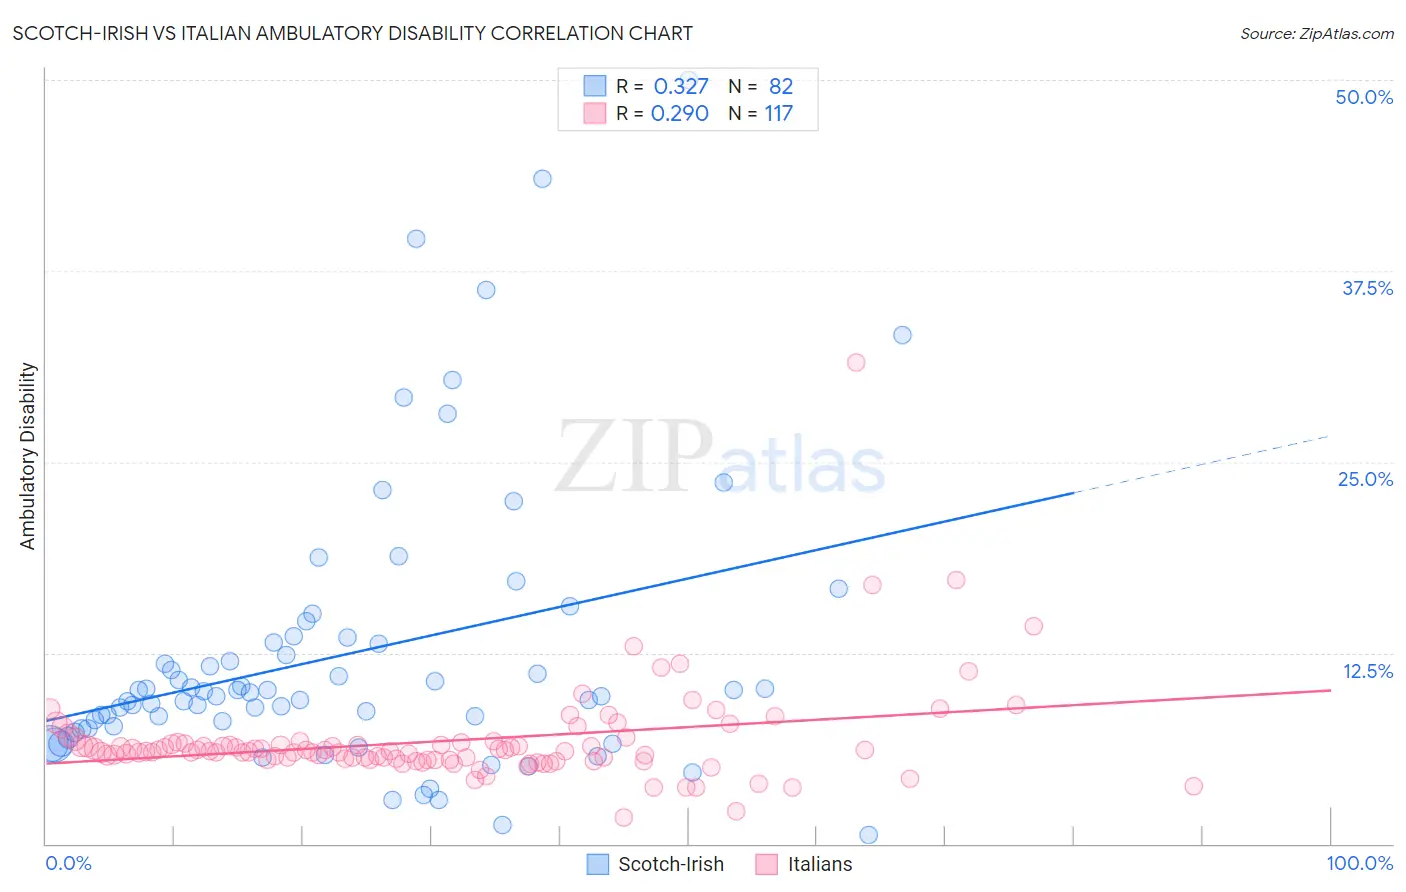
Scotch-Irish vs Italian Ambulatory Disability Correlation Chart
The statistical analysis conducted on geographies consisting of 548,439,452 people shows a mild positive correlation between the proportion of Scotch-Irish and percentage of population with ambulatory disability in the United States with a correlation coefficient (R) of 0.327 and weighted average of 6.9%. Similarly, the statistical analysis conducted on geographies consisting of 574,457,060 people shows a weak positive correlation between the proportion of Italians and percentage of population with ambulatory disability in the United States with a correlation coefficient (R) of 0.290 and weighted average of 6.2%, a difference of 10.4%.
Ambulatory Disability Correlation Summary
| Measurement | Scotch-Irish | Italian |
| Minimum | 0.57% | 1.8% |
| Maximum | 50.0% | 31.5% |
| Range | 49.4% | 29.8% |
| Mean | 12.4% | 6.7% |
| Median | 9.8% | 6.1% |
| Interquartile 25% (IQ1) | 7.5% | 5.5% |
| Interquartile 75% (IQ3) | 13.2% | 6.6% |
| Interquartile Range (IQR) | 5.6% | 1.1% |
| Standard Deviation (Sample) | 9.3% | 3.3% |
| Standard Deviation (Population) | 9.2% | 3.2% |
Similar Demographics by Ambulatory Disability
Demographics Similar to Scotch-Irish by Ambulatory Disability
In terms of ambulatory disability, the demographic groups most similar to Scotch-Irish are Immigrants from Dominica (6.9%, a difference of 0.030%), West Indian (6.9%, a difference of 0.10%), Cheyenne (6.9%, a difference of 0.16%), Nonimmigrants (6.9%, a difference of 0.17%), and Immigrants from St. Vincent and the Grenadines (6.9%, a difference of 0.40%).
| Demographics | Rating | Rank | Ambulatory Disability |
| Immigrants | Barbados | 0.0 /100 | #283 | Tragic 6.8% |
| Immigrants | Jamaica | 0.0 /100 | #284 | Tragic 6.8% |
| Fijians | 0.0 /100 | #285 | Tragic 6.8% |
| Yakama | 0.0 /100 | #286 | Tragic 6.8% |
| U.S. Virgin Islanders | 0.0 /100 | #287 | Tragic 6.8% |
| Immigrants | Nonimmigrants | 0.0 /100 | #288 | Tragic 6.9% |
| Immigrants | Dominica | 0.0 /100 | #289 | Tragic 6.9% |
| Scotch-Irish | 0.0 /100 | #290 | Tragic 6.9% |
| West Indians | 0.0 /100 | #291 | Tragic 6.9% |
| Cheyenne | 0.0 /100 | #292 | Tragic 6.9% |
| Immigrants | St. Vincent and the Grenadines | 0.0 /100 | #293 | Tragic 6.9% |
| Cape Verdeans | 0.0 /100 | #294 | Tragic 6.9% |
| Crow | 0.0 /100 | #295 | Tragic 6.9% |
| Alaskan Athabascans | 0.0 /100 | #296 | Tragic 6.9% |
| French American Indians | 0.0 /100 | #297 | Tragic 6.9% |
Demographics Similar to Italians by Ambulatory Disability
In terms of ambulatory disability, the demographic groups most similar to Italians are Immigrants from Cambodia (6.2%, a difference of 0.080%), Immigrants from Bangladesh (6.2%, a difference of 0.14%), Immigrants from Central America (6.2%, a difference of 0.20%), Albanian (6.2%, a difference of 0.22%), and Polish (6.2%, a difference of 0.26%).
| Demographics | Rating | Rank | Ambulatory Disability |
| Immigrants | Western Europe | 31.6 /100 | #192 | Fair 6.2% |
| Guatemalans | 30.0 /100 | #193 | Fair 6.2% |
| Alaska Natives | 29.8 /100 | #194 | Fair 6.2% |
| Belgians | 28.6 /100 | #195 | Fair 6.2% |
| Malaysians | 28.2 /100 | #196 | Fair 6.2% |
| Poles | 26.3 /100 | #197 | Fair 6.2% |
| Immigrants | Bangladesh | 24.6 /100 | #198 | Fair 6.2% |
| Italians | 22.6 /100 | #199 | Fair 6.2% |
| Immigrants | Cambodia | 21.5 /100 | #200 | Fair 6.2% |
| Immigrants | Central America | 20.1 /100 | #201 | Fair 6.2% |
| Albanians | 19.7 /100 | #202 | Poor 6.2% |
| Immigrants | Ukraine | 18.4 /100 | #203 | Poor 6.2% |
| Immigrants | Congo | 18.2 /100 | #204 | Poor 6.2% |
| Slovenes | 18.0 /100 | #205 | Poor 6.2% |
| Finns | 17.2 /100 | #206 | Poor 6.2% |