Scotch-Irish vs Immigrants from Southern Europe Ambulatory Disability
COMPARE
Scotch-Irish
Immigrants from Southern Europe
Ambulatory Disability
Ambulatory Disability Comparison
Scotch-Irish
Immigrants from Southern Europe
6.9%
AMBULATORY DISABILITY
0.0/ 100
METRIC RATING
290th/ 347
METRIC RANK
6.1%
AMBULATORY DISABILITY
58.1/ 100
METRIC RATING
169th/ 347
METRIC RANK
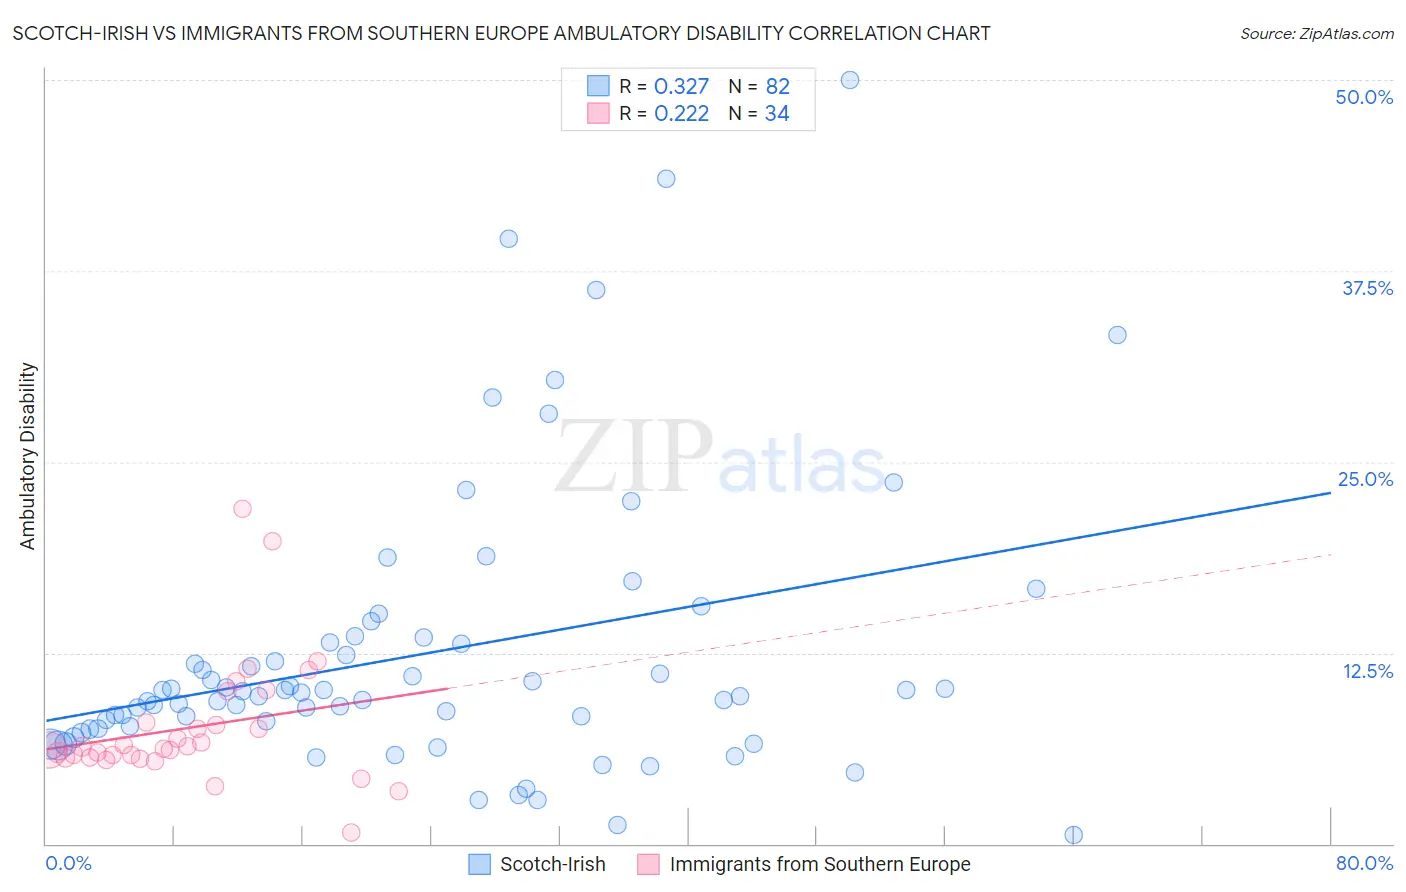
Scotch-Irish vs Immigrants from Southern Europe Ambulatory Disability Correlation Chart
The statistical analysis conducted on geographies consisting of 548,439,452 people shows a mild positive correlation between the proportion of Scotch-Irish and percentage of population with ambulatory disability in the United States with a correlation coefficient (R) of 0.327 and weighted average of 6.9%. Similarly, the statistical analysis conducted on geographies consisting of 402,703,105 people shows a weak positive correlation between the proportion of Immigrants from Southern Europe and percentage of population with ambulatory disability in the United States with a correlation coefficient (R) of 0.222 and weighted average of 6.1%, a difference of 12.7%.
Ambulatory Disability Correlation Summary
| Measurement | Scotch-Irish | Immigrants from Southern Europe |
| Minimum | 0.57% | 0.74% |
| Maximum | 50.0% | 22.0% |
| Range | 49.4% | 21.2% |
| Mean | 12.4% | 7.6% |
| Median | 9.8% | 6.3% |
| Interquartile 25% (IQ1) | 7.5% | 5.7% |
| Interquartile 75% (IQ3) | 13.2% | 7.9% |
| Interquartile Range (IQR) | 5.6% | 2.3% |
| Standard Deviation (Sample) | 9.3% | 4.1% |
| Standard Deviation (Population) | 9.2% | 4.1% |
Similar Demographics by Ambulatory Disability
Demographics Similar to Scotch-Irish by Ambulatory Disability
In terms of ambulatory disability, the demographic groups most similar to Scotch-Irish are Immigrants from Dominica (6.9%, a difference of 0.030%), West Indian (6.9%, a difference of 0.10%), Cheyenne (6.9%, a difference of 0.16%), Nonimmigrants (6.9%, a difference of 0.17%), and Immigrants from St. Vincent and the Grenadines (6.9%, a difference of 0.40%).
| Demographics | Rating | Rank | Ambulatory Disability |
| Immigrants | Barbados | 0.0 /100 | #283 | Tragic 6.8% |
| Immigrants | Jamaica | 0.0 /100 | #284 | Tragic 6.8% |
| Fijians | 0.0 /100 | #285 | Tragic 6.8% |
| Yakama | 0.0 /100 | #286 | Tragic 6.8% |
| U.S. Virgin Islanders | 0.0 /100 | #287 | Tragic 6.8% |
| Immigrants | Nonimmigrants | 0.0 /100 | #288 | Tragic 6.9% |
| Immigrants | Dominica | 0.0 /100 | #289 | Tragic 6.9% |
| Scotch-Irish | 0.0 /100 | #290 | Tragic 6.9% |
| West Indians | 0.0 /100 | #291 | Tragic 6.9% |
| Cheyenne | 0.0 /100 | #292 | Tragic 6.9% |
| Immigrants | St. Vincent and the Grenadines | 0.0 /100 | #293 | Tragic 6.9% |
| Cape Verdeans | 0.0 /100 | #294 | Tragic 6.9% |
| Crow | 0.0 /100 | #295 | Tragic 6.9% |
| Alaskan Athabascans | 0.0 /100 | #296 | Tragic 6.9% |
| French American Indians | 0.0 /100 | #297 | Tragic 6.9% |
Demographics Similar to Immigrants from Southern Europe by Ambulatory Disability
In terms of ambulatory disability, the demographic groups most similar to Immigrants from Southern Europe are Ecuadorian (6.1%, a difference of 0.14%), Immigrants from Oceania (6.1%, a difference of 0.15%), Immigrants from Ecuador (6.1%, a difference of 0.23%), Iraqi (6.1%, a difference of 0.26%), and Nicaraguan (6.1%, a difference of 0.29%).
| Demographics | Rating | Rank | Ambulatory Disability |
| Nigerians | 67.1 /100 | #162 | Good 6.1% |
| Lebanese | 66.2 /100 | #163 | Good 6.1% |
| Basques | 63.7 /100 | #164 | Good 6.1% |
| Nicaraguans | 63.2 /100 | #165 | Good 6.1% |
| Iraqis | 62.8 /100 | #166 | Good 6.1% |
| Immigrants | Oceania | 60.7 /100 | #167 | Good 6.1% |
| Ecuadorians | 60.5 /100 | #168 | Good 6.1% |
| Immigrants | Southern Europe | 58.1 /100 | #169 | Average 6.1% |
| Immigrants | Ecuador | 53.8 /100 | #170 | Average 6.1% |
| Moroccans | 52.6 /100 | #171 | Average 6.1% |
| Immigrants | Burma/Myanmar | 52.2 /100 | #172 | Average 6.1% |
| Croatians | 51.2 /100 | #173 | Average 6.1% |
| Immigrants | Canada | 50.0 /100 | #174 | Average 6.1% |
| Vietnamese | 47.2 /100 | #175 | Average 6.1% |
| Immigrants | North America | 45.6 /100 | #176 | Average 6.1% |