Immigrants from Peru vs Haitian Disability Age 35 to 64
COMPARE
Immigrants from Peru
Haitian
Disability Age 35 to 64
Disability Age 35 to 64 Comparison
Immigrants from Peru
Haitians
9.8%
DISABILITY AGE 35 TO 64
99.9/ 100
METRIC RATING
45th/ 347
METRIC RANK
11.2%
DISABILITY AGE 35 TO 64
59.0/ 100
METRIC RATING
169th/ 347
METRIC RANK
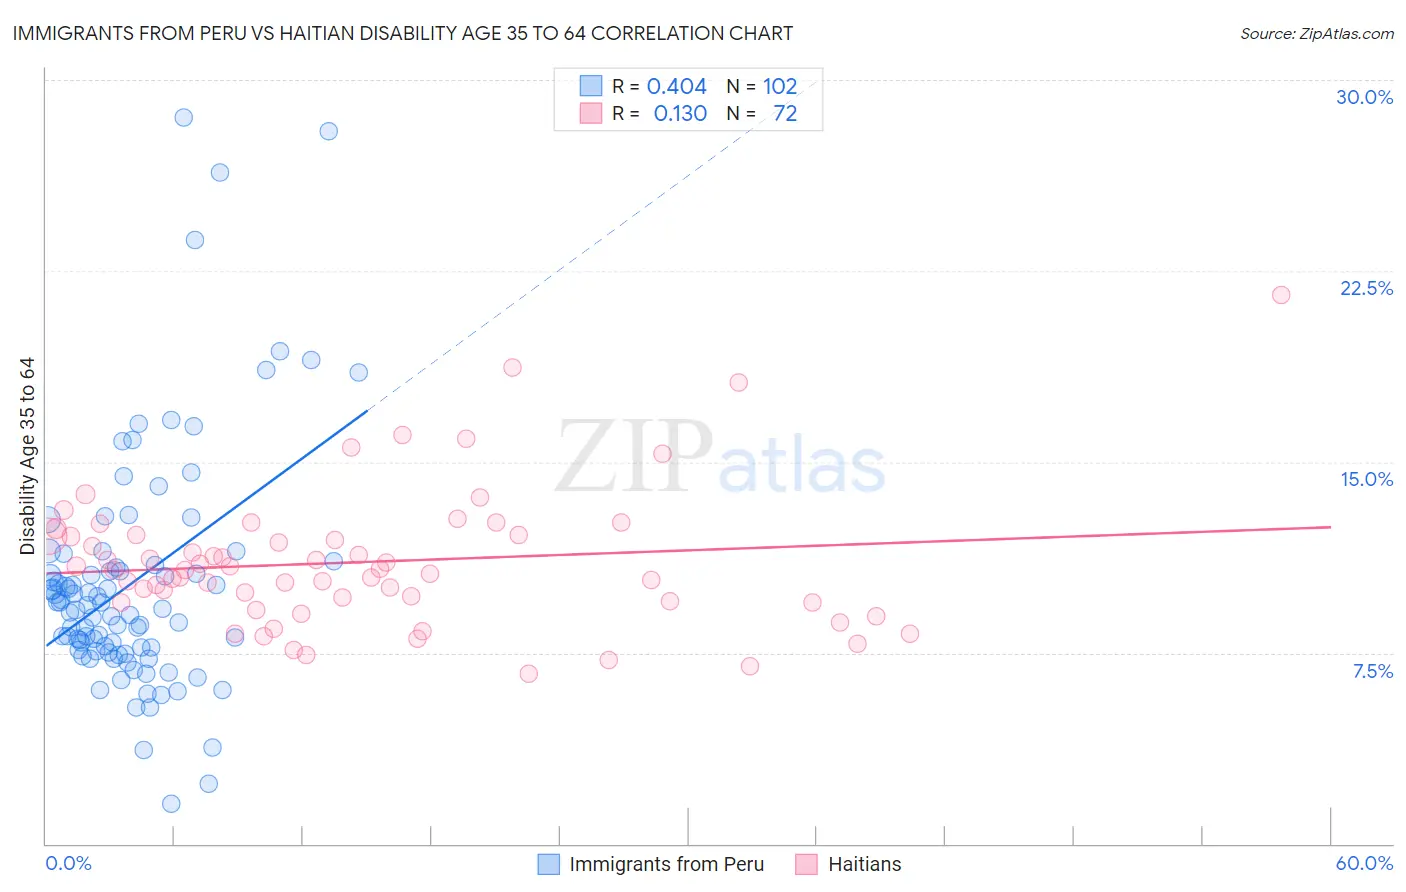
Immigrants from Peru vs Haitian Disability Age 35 to 64 Correlation Chart
The statistical analysis conducted on geographies consisting of 328,733,403 people shows a moderate positive correlation between the proportion of Immigrants from Peru and percentage of population with a disability between the ages 34 and 64 in the United States with a correlation coefficient (R) of 0.404 and weighted average of 9.8%. Similarly, the statistical analysis conducted on geographies consisting of 287,610,398 people shows a poor positive correlation between the proportion of Haitians and percentage of population with a disability between the ages 34 and 64 in the United States with a correlation coefficient (R) of 0.130 and weighted average of 11.2%, a difference of 14.2%.
Disability Age 35 to 64 Correlation Summary
| Measurement | Immigrants from Peru | Haitian |
| Minimum | 1.6% | 6.7% |
| Maximum | 28.5% | 21.5% |
| Range | 27.0% | 14.9% |
| Mean | 10.3% | 11.1% |
| Median | 9.3% | 10.7% |
| Interquartile 25% (IQ1) | 7.6% | 9.5% |
| Interquartile 75% (IQ3) | 11.0% | 12.1% |
| Interquartile Range (IQR) | 3.4% | 2.6% |
| Standard Deviation (Sample) | 4.7% | 2.7% |
| Standard Deviation (Population) | 4.7% | 2.7% |
Similar Demographics by Disability Age 35 to 64
Demographics Similar to Immigrants from Peru by Disability Age 35 to 64
In terms of disability age 35 to 64, the demographic groups most similar to Immigrants from Peru are Immigrants from Egypt (9.8%, a difference of 0.060%), Cambodian (9.8%, a difference of 0.18%), Immigrants from Belgium (9.8%, a difference of 0.24%), Immigrants from Serbia (9.8%, a difference of 0.25%), and Immigrants from Greece (9.8%, a difference of 0.29%).
| Demographics | Rating | Rank | Disability Age 35 to 64 |
| Egyptians | 99.9 /100 | #38 | Exceptional 9.7% |
| Immigrants | Belarus | 99.9 /100 | #39 | Exceptional 9.7% |
| Immigrants | Armenia | 99.9 /100 | #40 | Exceptional 9.7% |
| Israelis | 99.9 /100 | #41 | Exceptional 9.7% |
| Immigrants | Malaysia | 99.9 /100 | #42 | Exceptional 9.7% |
| Immigrants | Colombia | 99.9 /100 | #43 | Exceptional 9.8% |
| Immigrants | Egypt | 99.9 /100 | #44 | Exceptional 9.8% |
| Immigrants | Peru | 99.9 /100 | #45 | Exceptional 9.8% |
| Cambodians | 99.8 /100 | #46 | Exceptional 9.8% |
| Immigrants | Belgium | 99.8 /100 | #47 | Exceptional 9.8% |
| Immigrants | Serbia | 99.8 /100 | #48 | Exceptional 9.8% |
| Immigrants | Greece | 99.8 /100 | #49 | Exceptional 9.8% |
| Paraguayans | 99.8 /100 | #50 | Exceptional 9.8% |
| Bhutanese | 99.8 /100 | #51 | Exceptional 9.8% |
| Immigrants | Bulgaria | 99.8 /100 | #52 | Exceptional 9.8% |
Demographics Similar to Haitians by Disability Age 35 to 64
In terms of disability age 35 to 64, the demographic groups most similar to Haitians are Central American (11.2%, a difference of 0.010%), Immigrants from Uganda (11.2%, a difference of 0.080%), Immigrants from Trinidad and Tobago (11.2%, a difference of 0.25%), Italian (11.2%, a difference of 0.27%), and Austrian (11.1%, a difference of 0.36%).
| Demographics | Rating | Rank | Disability Age 35 to 64 |
| Immigrants | Grenada | 68.4 /100 | #162 | Good 11.1% |
| Immigrants | St. Vincent and the Grenadines | 66.6 /100 | #163 | Good 11.1% |
| Pakistanis | 65.8 /100 | #164 | Good 11.1% |
| Immigrants | Western Europe | 65.2 /100 | #165 | Good 11.1% |
| Immigrants | Haiti | 63.8 /100 | #166 | Good 11.1% |
| Austrians | 63.2 /100 | #167 | Good 11.1% |
| Central Americans | 59.1 /100 | #168 | Average 11.2% |
| Haitians | 59.0 /100 | #169 | Average 11.2% |
| Immigrants | Uganda | 58.0 /100 | #170 | Average 11.2% |
| Immigrants | Trinidad and Tobago | 55.9 /100 | #171 | Average 11.2% |
| Italians | 55.6 /100 | #172 | Average 11.2% |
| Lebanese | 51.8 /100 | #173 | Average 11.3% |
| Immigrants | Fiji | 50.0 /100 | #174 | Average 11.3% |
| Czechs | 47.9 /100 | #175 | Average 11.3% |
| Ugandans | 43.7 /100 | #176 | Average 11.3% |