U.S. Virgin Islander vs French American Indian Cognitive Disability
COMPARE
U.S. Virgin Islander
French American Indian
Cognitive Disability
Cognitive Disability Comparison
U.S. Virgin Islanders
French American Indians
18.7%
COGNITIVE DISABILITY
0.0/ 100
METRIC RATING
327th/ 347
METRIC RANK
17.9%
COGNITIVE DISABILITY
0.7/ 100
METRIC RATING
248th/ 347
METRIC RANK
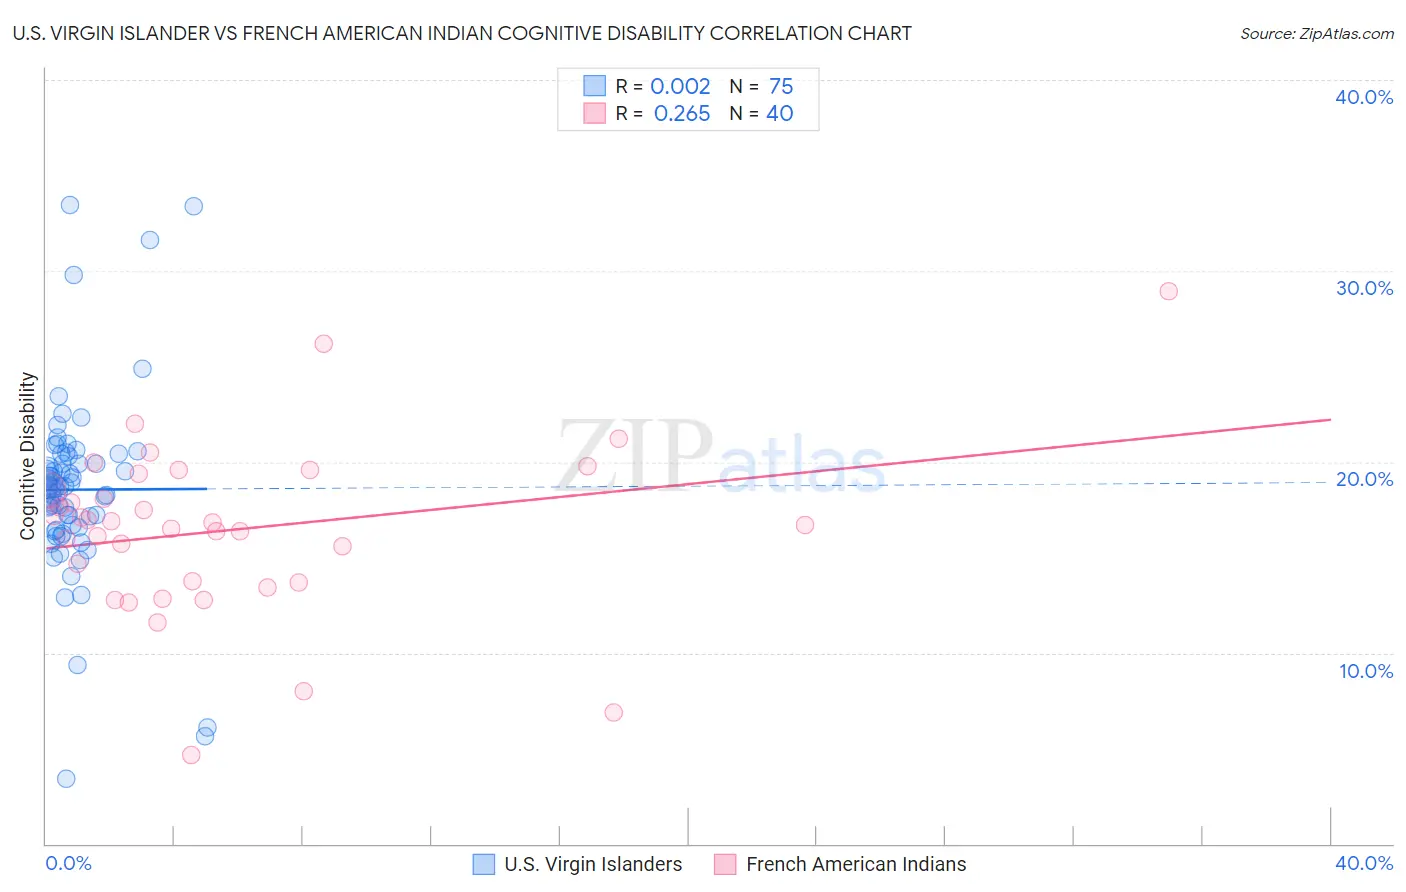
U.S. Virgin Islander vs French American Indian Cognitive Disability Correlation Chart
The statistical analysis conducted on geographies consisting of 87,523,462 people shows no correlation between the proportion of U.S. Virgin Islanders and percentage of population with cognitive disability in the United States with a correlation coefficient (R) of 0.002 and weighted average of 18.7%. Similarly, the statistical analysis conducted on geographies consisting of 131,963,087 people shows a weak positive correlation between the proportion of French American Indians and percentage of population with cognitive disability in the United States with a correlation coefficient (R) of 0.265 and weighted average of 17.9%, a difference of 4.6%.
Cognitive Disability Correlation Summary
| Measurement | U.S. Virgin Islander | French American Indian |
| Minimum | 3.4% | 4.6% |
| Maximum | 33.5% | 28.9% |
| Range | 30.0% | 24.3% |
| Mean | 18.5% | 16.5% |
| Median | 18.6% | 16.7% |
| Interquartile 25% (IQ1) | 16.6% | 13.7% |
| Interquartile 75% (IQ3) | 20.3% | 19.0% |
| Interquartile Range (IQR) | 3.7% | 5.3% |
| Standard Deviation (Sample) | 4.8% | 4.5% |
| Standard Deviation (Population) | 4.8% | 4.5% |
Similar Demographics by Cognitive Disability
Demographics Similar to U.S. Virgin Islanders by Cognitive Disability
In terms of cognitive disability, the demographic groups most similar to U.S. Virgin Islanders are Immigrants from Senegal (18.7%, a difference of 0.040%), Indonesian (18.7%, a difference of 0.060%), Kiowa (18.7%, a difference of 0.060%), Dominican (18.7%, a difference of 0.14%), and Pueblo (18.7%, a difference of 0.26%).
| Demographics | Rating | Rank | Cognitive Disability |
| Apache | 0.0 /100 | #320 | Tragic 18.6% |
| Africans | 0.0 /100 | #321 | Tragic 18.6% |
| Immigrants | Liberia | 0.0 /100 | #322 | Tragic 18.7% |
| Pueblo | 0.0 /100 | #323 | Tragic 18.7% |
| Dominicans | 0.0 /100 | #324 | Tragic 18.7% |
| Indonesians | 0.0 /100 | #325 | Tragic 18.7% |
| Immigrants | Senegal | 0.0 /100 | #326 | Tragic 18.7% |
| U.S. Virgin Islanders | 0.0 /100 | #327 | Tragic 18.7% |
| Kiowa | 0.0 /100 | #328 | Tragic 18.7% |
| Navajo | 0.0 /100 | #329 | Tragic 18.8% |
| Immigrants | Dominican Republic | 0.0 /100 | #330 | Tragic 18.8% |
| Pima | 0.0 /100 | #331 | Tragic 18.8% |
| Immigrants | Sudan | 0.0 /100 | #332 | Tragic 18.8% |
| Immigrants | Yemen | 0.0 /100 | #333 | Tragic 18.8% |
| Sudanese | 0.0 /100 | #334 | Tragic 18.9% |
Demographics Similar to French American Indians by Cognitive Disability
In terms of cognitive disability, the demographic groups most similar to French American Indians are Samoan (17.9%, a difference of 0.010%), Cree (17.9%, a difference of 0.050%), Immigrants from Ethiopia (17.9%, a difference of 0.050%), Malaysian (17.9%, a difference of 0.060%), and Immigrants from Grenada (17.9%, a difference of 0.070%).
| Demographics | Rating | Rank | Cognitive Disability |
| Mexicans | 1.1 /100 | #241 | Tragic 17.8% |
| Paiute | 1.1 /100 | #242 | Tragic 17.8% |
| Immigrants | Bangladesh | 1.0 /100 | #243 | Tragic 17.8% |
| Jamaicans | 0.9 /100 | #244 | Tragic 17.9% |
| Trinidadians and Tobagonians | 0.8 /100 | #245 | Tragic 17.9% |
| Immigrants | Thailand | 0.8 /100 | #246 | Tragic 17.9% |
| Samoans | 0.7 /100 | #247 | Tragic 17.9% |
| French American Indians | 0.7 /100 | #248 | Tragic 17.9% |
| Cree | 0.7 /100 | #249 | Tragic 17.9% |
| Immigrants | Ethiopia | 0.7 /100 | #250 | Tragic 17.9% |
| Malaysians | 0.6 /100 | #251 | Tragic 17.9% |
| Immigrants | Grenada | 0.6 /100 | #252 | Tragic 17.9% |
| Hopi | 0.6 /100 | #253 | Tragic 17.9% |
| Hispanics or Latinos | 0.6 /100 | #254 | Tragic 17.9% |
| Immigrants | Azores | 0.6 /100 | #255 | Tragic 17.9% |