Immigrants from Latvia vs Spanish American Indian Disability
COMPARE
Immigrants from Latvia
Spanish American Indian
Disability
Disability Comparison
Immigrants from Latvia
Spanish American Indians
11.4%
DISABILITY
90.9/ 100
METRIC RATING
126th/ 347
METRIC RANK
12.1%
DISABILITY
4.1/ 100
METRIC RATING
222nd/ 347
METRIC RANK
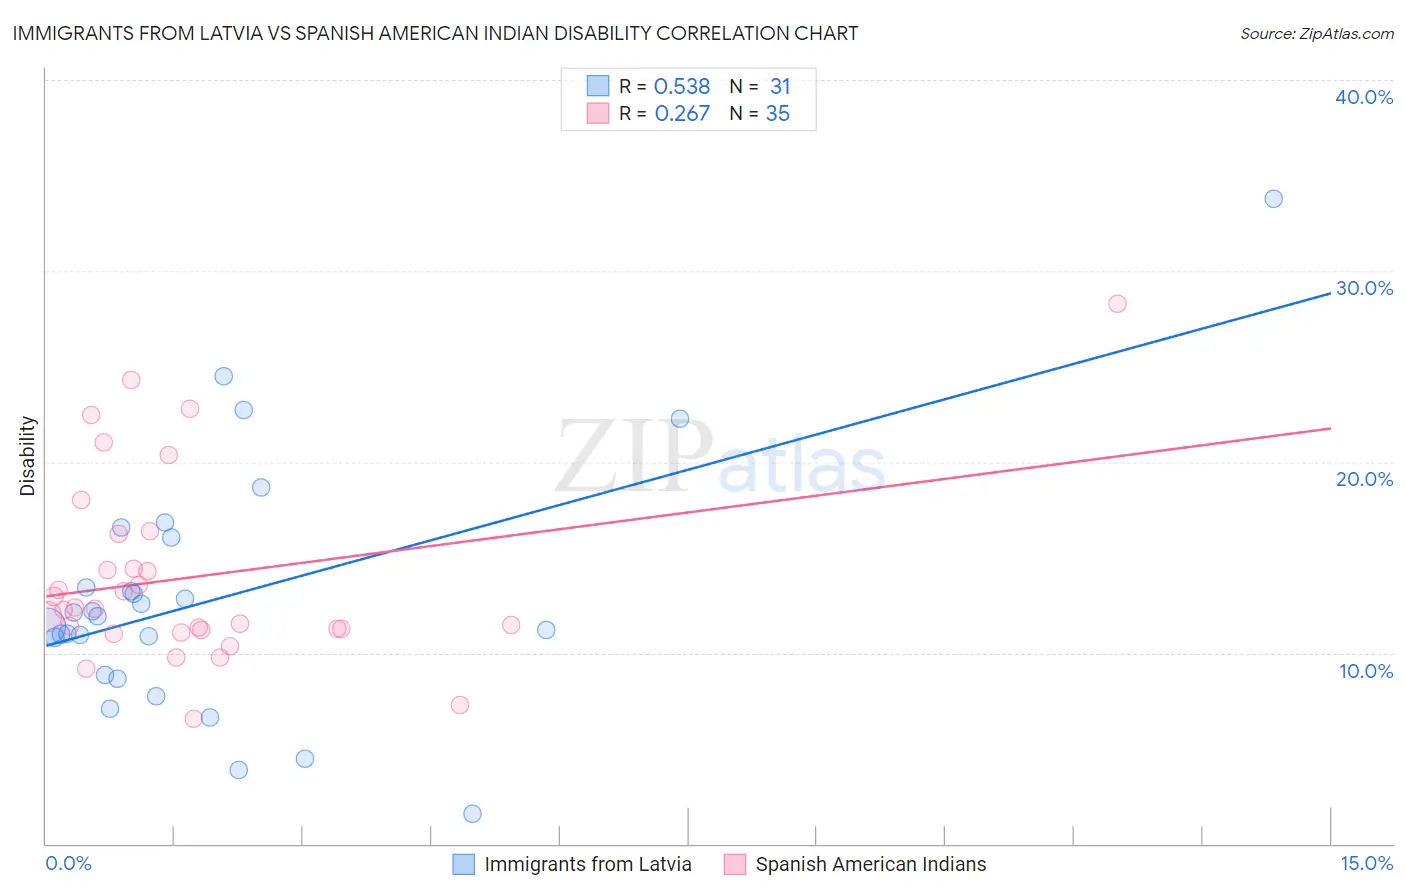
Immigrants from Latvia vs Spanish American Indian Disability Correlation Chart
The statistical analysis conducted on geographies consisting of 113,739,259 people shows a substantial positive correlation between the proportion of Immigrants from Latvia and percentage of population with a disability in the United States with a correlation coefficient (R) of 0.538 and weighted average of 11.4%. Similarly, the statistical analysis conducted on geographies consisting of 73,149,525 people shows a weak positive correlation between the proportion of Spanish American Indians and percentage of population with a disability in the United States with a correlation coefficient (R) of 0.267 and weighted average of 12.1%, a difference of 6.2%.
Disability Correlation Summary
| Measurement | Immigrants from Latvia | Spanish American Indian |
| Minimum | 1.5% | 6.5% |
| Maximum | 33.8% | 28.3% |
| Range | 32.2% | 21.7% |
| Mean | 12.9% | 14.0% |
| Median | 11.9% | 12.3% |
| Interquartile 25% (IQ1) | 8.8% | 11.2% |
| Interquartile 75% (IQ3) | 16.0% | 16.3% |
| Interquartile Range (IQR) | 7.2% | 5.1% |
| Standard Deviation (Sample) | 6.5% | 4.9% |
| Standard Deviation (Population) | 6.4% | 4.9% |
Similar Demographics by Disability
Demographics Similar to Immigrants from Latvia by Disability
In terms of disability, the demographic groups most similar to Immigrants from Latvia are Immigrants from Italy (11.4%, a difference of 0.070%), Immigrants from Europe (11.4%, a difference of 0.070%), Macedonian (11.4%, a difference of 0.080%), Latvian (11.4%, a difference of 0.14%), and Costa Rican (11.4%, a difference of 0.15%).
| Demographics | Rating | Rank | Disability |
| Central Americans | 93.5 /100 | #119 | Exceptional 11.4% |
| Immigrants | North Macedonia | 93.5 /100 | #120 | Exceptional 11.4% |
| Immigrants | Costa Rica | 93.4 /100 | #121 | Exceptional 11.4% |
| Brazilians | 93.3 /100 | #122 | Exceptional 11.4% |
| South Africans | 92.3 /100 | #123 | Exceptional 11.4% |
| South American Indians | 92.2 /100 | #124 | Exceptional 11.4% |
| Costa Ricans | 91.9 /100 | #125 | Exceptional 11.4% |
| Immigrants | Latvia | 90.9 /100 | #126 | Exceptional 11.4% |
| Immigrants | Italy | 90.4 /100 | #127 | Exceptional 11.4% |
| Immigrants | Europe | 90.4 /100 | #128 | Exceptional 11.4% |
| Macedonians | 90.3 /100 | #129 | Exceptional 11.4% |
| Latvians | 89.8 /100 | #130 | Excellent 11.4% |
| Immigrants | Croatia | 89.8 /100 | #131 | Excellent 11.4% |
| Immigrants | Africa | 89.3 /100 | #132 | Excellent 11.4% |
| Arabs | 89.1 /100 | #133 | Excellent 11.4% |
Demographics Similar to Spanish American Indians by Disability
In terms of disability, the demographic groups most similar to Spanish American Indians are Northern European (12.1%, a difference of 0.040%), Hispanic or Latino (12.1%, a difference of 0.040%), Mexican (12.1%, a difference of 0.10%), Immigrants from Bahamas (12.1%, a difference of 0.16%), and Senegalese (12.1%, a difference of 0.18%).
| Demographics | Rating | Rank | Disability |
| Immigrants | Canada | 6.1 /100 | #215 | Tragic 12.1% |
| Panamanians | 5.4 /100 | #216 | Tragic 12.1% |
| Immigrants | North America | 5.3 /100 | #217 | Tragic 12.1% |
| Immigrants | Jamaica | 5.0 /100 | #218 | Tragic 12.1% |
| Croatians | 4.9 /100 | #219 | Tragic 12.1% |
| Immigrants | Bahamas | 4.7 /100 | #220 | Tragic 12.1% |
| Northern Europeans | 4.2 /100 | #221 | Tragic 12.1% |
| Spanish American Indians | 4.1 /100 | #222 | Tragic 12.1% |
| Hispanics or Latinos | 3.9 /100 | #223 | Tragic 12.1% |
| Mexicans | 3.7 /100 | #224 | Tragic 12.1% |
| Senegalese | 3.5 /100 | #225 | Tragic 12.1% |
| Jamaicans | 3.3 /100 | #226 | Tragic 12.1% |
| Alsatians | 3.3 /100 | #227 | Tragic 12.1% |
| West Indians | 2.9 /100 | #228 | Tragic 12.2% |
| Inupiat | 2.8 /100 | #229 | Tragic 12.2% |