Immigrants from Korea vs Spaniard Male Disability
COMPARE
Immigrants from Korea
Spaniard
Male Disability
Male Disability Comparison
Immigrants from Korea
Spaniards
9.8%
MALE DISABILITY
100.0/ 100
METRIC RATING
17th/ 347
METRIC RANK
12.3%
MALE DISABILITY
0.1/ 100
METRIC RATING
270th/ 347
METRIC RANK
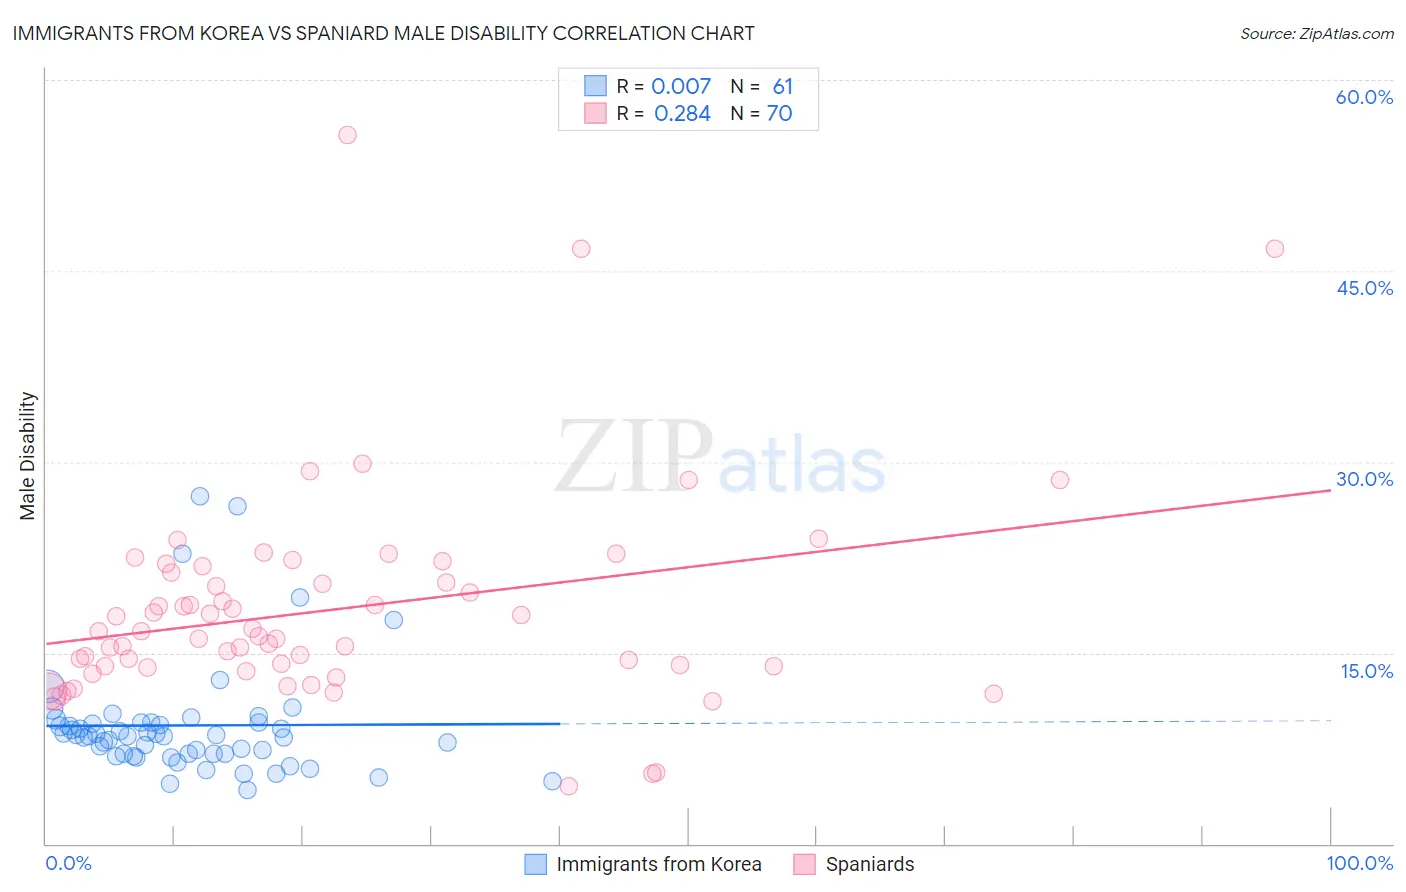
Immigrants from Korea vs Spaniard Male Disability Correlation Chart
The statistical analysis conducted on geographies consisting of 416,248,293 people shows no correlation between the proportion of Immigrants from Korea and percentage of males with a disability in the United States with a correlation coefficient (R) of 0.007 and weighted average of 9.8%. Similarly, the statistical analysis conducted on geographies consisting of 443,401,909 people shows a weak positive correlation between the proportion of Spaniards and percentage of males with a disability in the United States with a correlation coefficient (R) of 0.284 and weighted average of 12.3%, a difference of 25.6%.
Male Disability Correlation Summary
| Measurement | Immigrants from Korea | Spaniard |
| Minimum | 4.2% | 4.5% |
| Maximum | 27.3% | 55.7% |
| Range | 23.1% | 51.2% |
| Mean | 9.3% | 18.4% |
| Median | 8.5% | 16.5% |
| Interquartile 25% (IQ1) | 7.0% | 13.9% |
| Interquartile 75% (IQ3) | 9.6% | 21.3% |
| Interquartile Range (IQR) | 2.5% | 7.4% |
| Standard Deviation (Sample) | 4.5% | 8.5% |
| Standard Deviation (Population) | 4.5% | 8.4% |
Similar Demographics by Male Disability
Demographics Similar to Immigrants from Korea by Male Disability
In terms of male disability, the demographic groups most similar to Immigrants from Korea are Okinawan (9.8%, a difference of 0.14%), Immigrants from Pakistan (9.8%, a difference of 0.56%), Indian (Asian) (9.7%, a difference of 0.75%), Immigrants from Iran (9.7%, a difference of 1.2%), and Iranian (9.7%, a difference of 1.3%).
| Demographics | Rating | Rank | Male Disability |
| Immigrants | Israel | 100.0 /100 | #10 | Exceptional 9.6% |
| Immigrants | Eastern Asia | 100.0 /100 | #11 | Exceptional 9.6% |
| Bolivians | 100.0 /100 | #12 | Exceptional 9.6% |
| Iranians | 100.0 /100 | #13 | Exceptional 9.7% |
| Immigrants | Iran | 100.0 /100 | #14 | Exceptional 9.7% |
| Indians (Asian) | 100.0 /100 | #15 | Exceptional 9.7% |
| Okinawans | 100.0 /100 | #16 | Exceptional 9.8% |
| Immigrants | Korea | 100.0 /100 | #17 | Exceptional 9.8% |
| Immigrants | Pakistan | 100.0 /100 | #18 | Exceptional 9.8% |
| Immigrants | Sri Lanka | 100.0 /100 | #19 | Exceptional 10.0% |
| Asians | 100.0 /100 | #20 | Exceptional 10.0% |
| Burmese | 100.0 /100 | #21 | Exceptional 10.0% |
| Immigrants | Venezuela | 100.0 /100 | #22 | Exceptional 10.0% |
| Cypriots | 100.0 /100 | #23 | Exceptional 10.0% |
| Immigrants | Asia | 100.0 /100 | #24 | Exceptional 10.0% |
Demographics Similar to Spaniards by Male Disability
In terms of male disability, the demographic groups most similar to Spaniards are Czechoslovakian (12.3%, a difference of 0.080%), Portuguese (12.3%, a difference of 0.090%), Scandinavian (12.3%, a difference of 0.19%), Immigrants from Germany (12.3%, a difference of 0.21%), and Hawaiian (12.3%, a difference of 0.26%).
| Demographics | Rating | Rank | Male Disability |
| Canadians | 0.2 /100 | #263 | Tragic 12.2% |
| Nepalese | 0.2 /100 | #264 | Tragic 12.2% |
| Immigrants | Portugal | 0.1 /100 | #265 | Tragic 12.3% |
| Hawaiians | 0.1 /100 | #266 | Tragic 12.3% |
| Immigrants | Germany | 0.1 /100 | #267 | Tragic 12.3% |
| Portuguese | 0.1 /100 | #268 | Tragic 12.3% |
| Czechoslovakians | 0.1 /100 | #269 | Tragic 12.3% |
| Spaniards | 0.1 /100 | #270 | Tragic 12.3% |
| Scandinavians | 0.1 /100 | #271 | Tragic 12.3% |
| Hmong | 0.0 /100 | #272 | Tragic 12.5% |
| Native Hawaiians | 0.0 /100 | #273 | Tragic 12.5% |
| Hopi | 0.0 /100 | #274 | Tragic 12.5% |
| Fijians | 0.0 /100 | #275 | Tragic 12.6% |
| Africans | 0.0 /100 | #276 | Tragic 12.6% |
| Finns | 0.0 /100 | #277 | Tragic 12.6% |