Carpatho Rusyn vs Chippewa Female Disability
COMPARE
Carpatho Rusyn
Chippewa
Female Disability
Female Disability Comparison
Carpatho Rusyns
Chippewa
12.6%
FEMALE DISABILITY
2.0/ 100
METRIC RATING
248th/ 347
METRIC RANK
14.0%
FEMALE DISABILITY
0.0/ 100
METRIC RATING
317th/ 347
METRIC RANK
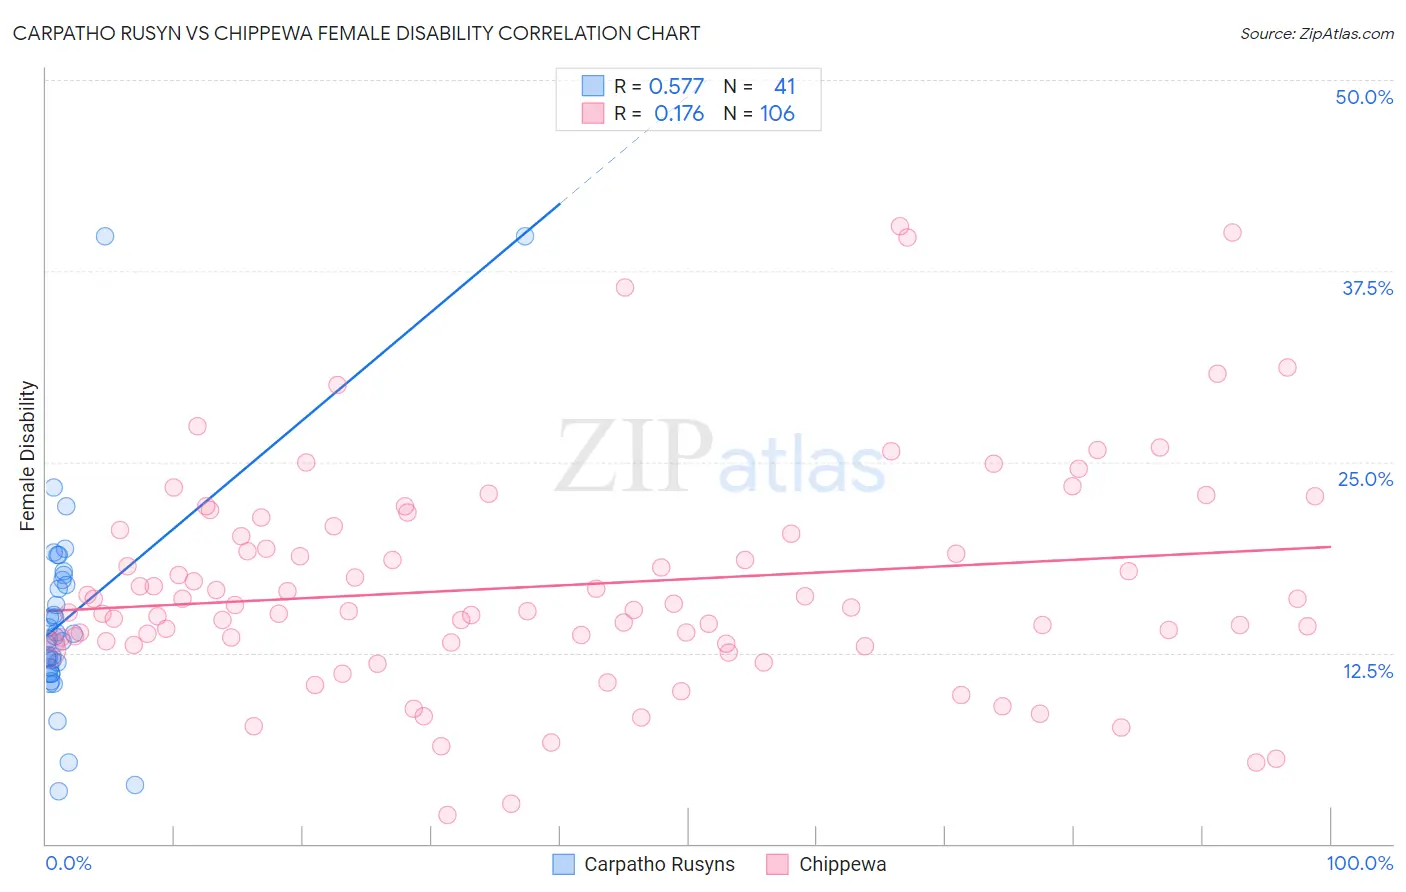
Carpatho Rusyn vs Chippewa Female Disability Correlation Chart
The statistical analysis conducted on geographies consisting of 58,872,330 people shows a substantial positive correlation between the proportion of Carpatho Rusyns and percentage of females with a disability in the United States with a correlation coefficient (R) of 0.577 and weighted average of 12.6%. Similarly, the statistical analysis conducted on geographies consisting of 215,042,988 people shows a poor positive correlation between the proportion of Chippewa and percentage of females with a disability in the United States with a correlation coefficient (R) of 0.176 and weighted average of 14.0%, a difference of 10.7%.
Female Disability Correlation Summary
| Measurement | Carpatho Rusyn | Chippewa |
| Minimum | 3.5% | 1.9% |
| Maximum | 39.8% | 40.4% |
| Range | 36.3% | 38.5% |
| Mean | 14.9% | 16.9% |
| Median | 13.6% | 15.4% |
| Interquartile 25% (IQ1) | 11.3% | 13.1% |
| Interquartile 75% (IQ3) | 17.4% | 20.3% |
| Interquartile Range (IQR) | 6.1% | 7.2% |
| Standard Deviation (Sample) | 7.1% | 7.2% |
| Standard Deviation (Population) | 7.0% | 7.2% |
Similar Demographics by Female Disability
Demographics Similar to Carpatho Rusyns by Female Disability
In terms of female disability, the demographic groups most similar to Carpatho Rusyns are Menominee (12.6%, a difference of 0.040%), Spanish American Indian (12.6%, a difference of 0.050%), Immigrants from Jamaica (12.6%, a difference of 0.070%), Immigrants from Congo (12.7%, a difference of 0.13%), and Slovene (12.7%, a difference of 0.17%).
| Demographics | Rating | Rank | Female Disability |
| Japanese | 2.7 /100 | #241 | Tragic 12.6% |
| Canadians | 2.6 /100 | #242 | Tragic 12.6% |
| Immigrants | Senegal | 2.5 /100 | #243 | Tragic 12.6% |
| Alsatians | 2.5 /100 | #244 | Tragic 12.6% |
| Immigrants | Jamaica | 2.2 /100 | #245 | Tragic 12.6% |
| Spanish American Indians | 2.1 /100 | #246 | Tragic 12.6% |
| Menominee | 2.1 /100 | #247 | Tragic 12.6% |
| Carpatho Rusyns | 2.0 /100 | #248 | Tragic 12.6% |
| Immigrants | Congo | 1.8 /100 | #249 | Tragic 12.7% |
| Slovenes | 1.7 /100 | #250 | Tragic 12.7% |
| Crow | 1.6 /100 | #251 | Tragic 12.7% |
| Immigrants | Caribbean | 1.4 /100 | #252 | Tragic 12.7% |
| Jamaicans | 1.4 /100 | #253 | Tragic 12.7% |
| Hawaiians | 1.4 /100 | #254 | Tragic 12.7% |
| Immigrants | Germany | 1.3 /100 | #255 | Tragic 12.7% |
Demographics Similar to Chippewa by Female Disability
In terms of female disability, the demographic groups most similar to Chippewa are Spanish American (14.0%, a difference of 0.11%), Paiute (14.0%, a difference of 0.11%), Iroquois (14.0%, a difference of 0.40%), Alaskan Athabascan (13.9%, a difference of 0.47%), and American (14.1%, a difference of 0.74%).
| Demographics | Rating | Rank | Female Disability |
| Apache | 0.0 /100 | #310 | Tragic 13.7% |
| Hopi | 0.0 /100 | #311 | Tragic 13.7% |
| Delaware | 0.0 /100 | #312 | Tragic 13.8% |
| Blackfeet | 0.0 /100 | #313 | Tragic 13.8% |
| Puget Sound Salish | 0.0 /100 | #314 | Tragic 13.8% |
| Alaskan Athabascans | 0.0 /100 | #315 | Tragic 13.9% |
| Spanish Americans | 0.0 /100 | #316 | Tragic 14.0% |
| Chippewa | 0.0 /100 | #317 | Tragic 14.0% |
| Paiute | 0.0 /100 | #318 | Tragic 14.0% |
| Iroquois | 0.0 /100 | #319 | Tragic 14.0% |
| Americans | 0.0 /100 | #320 | Tragic 14.1% |
| Potawatomi | 0.0 /100 | #321 | Tragic 14.1% |
| Pueblo | 0.0 /100 | #322 | Tragic 14.1% |
| Blacks/African Americans | 0.0 /100 | #323 | Tragic 14.1% |
| Natives/Alaskans | 0.0 /100 | #324 | Tragic 14.1% |