Samoan vs Immigrants from Grenada Male Unemployment
COMPARE
Samoan
Immigrants from Grenada
Male Unemployment
Male Unemployment Comparison
Samoans
Immigrants from Grenada
5.5%
MALE UNEMPLOYMENT
4.9/ 100
METRIC RATING
215th/ 347
METRIC RANK
7.6%
MALE UNEMPLOYMENT
0.0/ 100
METRIC RATING
323rd/ 347
METRIC RANK
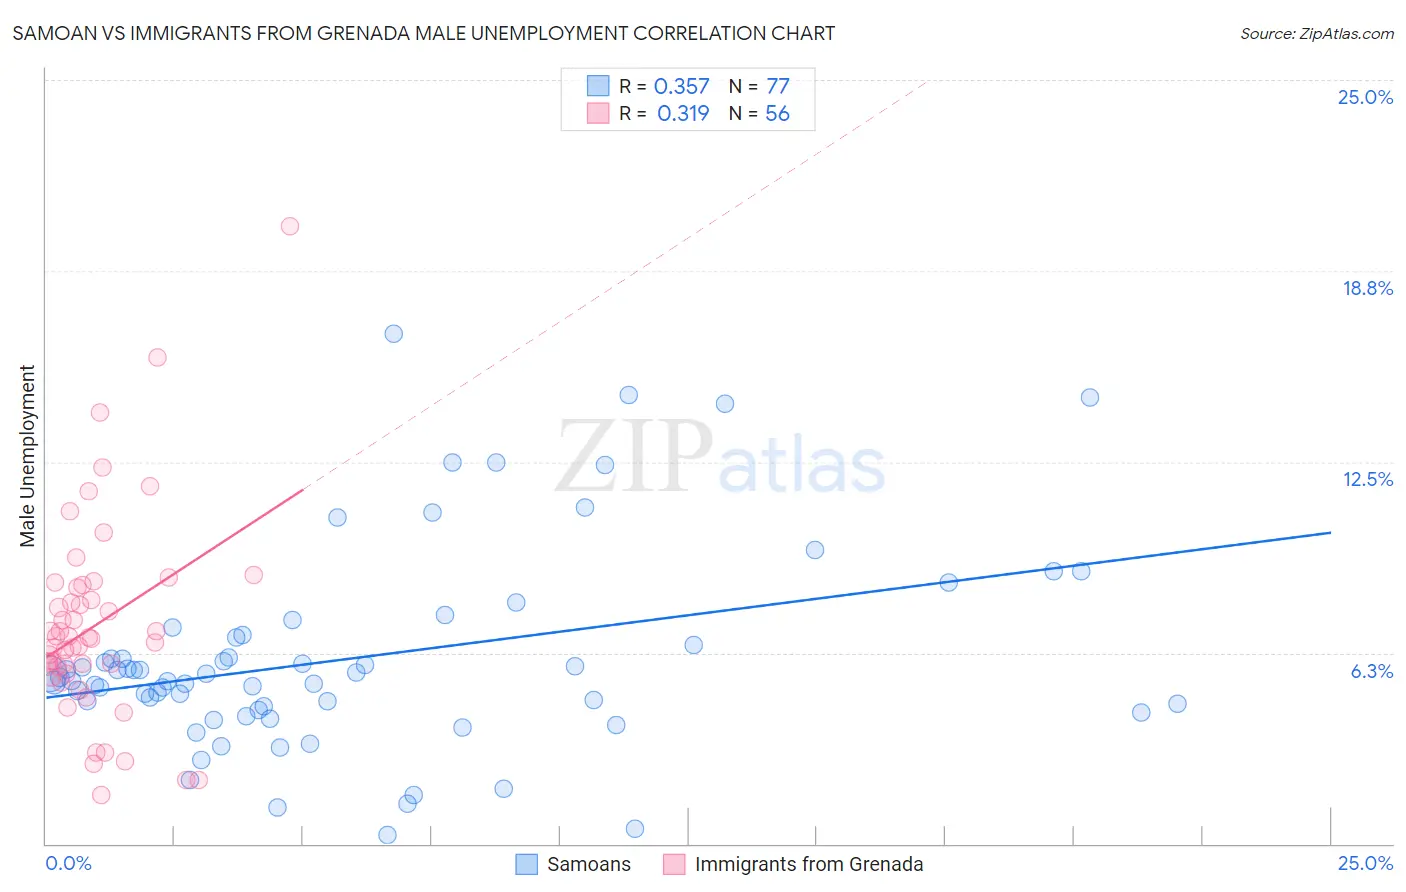
Samoan vs Immigrants from Grenada Male Unemployment Correlation Chart
The statistical analysis conducted on geographies consisting of 224,577,965 people shows a mild positive correlation between the proportion of Samoans and unemployment rate among males in the United States with a correlation coefficient (R) of 0.357 and weighted average of 5.5%. Similarly, the statistical analysis conducted on geographies consisting of 67,158,645 people shows a mild positive correlation between the proportion of Immigrants from Grenada and unemployment rate among males in the United States with a correlation coefficient (R) of 0.319 and weighted average of 7.6%, a difference of 36.7%.
Male Unemployment Correlation Summary
| Measurement | Samoan | Immigrants from Grenada |
| Minimum | 0.30% | 1.6% |
| Maximum | 16.7% | 20.2% |
| Range | 16.4% | 18.6% |
| Mean | 6.1% | 7.2% |
| Median | 5.5% | 6.7% |
| Interquartile 25% (IQ1) | 4.4% | 5.7% |
| Interquartile 75% (IQ3) | 6.8% | 8.4% |
| Interquartile Range (IQR) | 2.4% | 2.7% |
| Standard Deviation (Sample) | 3.3% | 3.3% |
| Standard Deviation (Population) | 3.3% | 3.3% |
Similar Demographics by Male Unemployment
Demographics Similar to Samoans by Male Unemployment
In terms of male unemployment, the demographic groups most similar to Samoans are Immigrants (5.5%, a difference of 0.17%), Puget Sound Salish (5.5%, a difference of 0.20%), Delaware (5.5%, a difference of 0.22%), Ugandan (5.5%, a difference of 0.37%), and Immigrants from Albania (5.5%, a difference of 0.43%).
| Demographics | Rating | Rank | Male Unemployment |
| Immigrants | Lebanon | 8.6 /100 | #208 | Tragic 5.5% |
| Immigrants | Middle Africa | 8.3 /100 | #209 | Tragic 5.5% |
| South American Indians | 7.6 /100 | #210 | Tragic 5.5% |
| Israelis | 7.4 /100 | #211 | Tragic 5.5% |
| Hmong | 7.0 /100 | #212 | Tragic 5.5% |
| Ugandans | 6.3 /100 | #213 | Tragic 5.5% |
| Puget Sound Salish | 5.6 /100 | #214 | Tragic 5.5% |
| Samoans | 4.9 /100 | #215 | Tragic 5.5% |
| Immigrants | Immigrants | 4.3 /100 | #216 | Tragic 5.5% |
| Delaware | 4.2 /100 | #217 | Tragic 5.5% |
| Immigrants | Albania | 3.6 /100 | #218 | Tragic 5.5% |
| Immigrants | Western Asia | 3.5 /100 | #219 | Tragic 5.6% |
| Portuguese | 3.5 /100 | #220 | Tragic 5.6% |
| Soviet Union | 3.2 /100 | #221 | Tragic 5.6% |
| Immigrants | Micronesia | 2.9 /100 | #222 | Tragic 5.6% |
Demographics Similar to Immigrants from Grenada by Male Unemployment
In terms of male unemployment, the demographic groups most similar to Immigrants from Grenada are Dominican (7.6%, a difference of 0.27%), Shoshone (7.6%, a difference of 0.65%), Immigrants from Dominican Republic (7.6%, a difference of 0.75%), Immigrants from Cabo Verde (7.5%, a difference of 0.79%), and Immigrants from St. Vincent and the Grenadines (7.5%, a difference of 1.1%).
| Demographics | Rating | Rank | Male Unemployment |
| Immigrants | Guyana | 0.0 /100 | #316 | Tragic 7.1% |
| Guyanese | 0.0 /100 | #317 | Tragic 7.1% |
| Cape Verdeans | 0.0 /100 | #318 | Tragic 7.1% |
| British West Indians | 0.0 /100 | #319 | Tragic 7.3% |
| Colville | 0.0 /100 | #320 | Tragic 7.4% |
| Immigrants | St. Vincent and the Grenadines | 0.0 /100 | #321 | Tragic 7.5% |
| Immigrants | Cabo Verde | 0.0 /100 | #322 | Tragic 7.5% |
| Immigrants | Grenada | 0.0 /100 | #323 | Tragic 7.6% |
| Dominicans | 0.0 /100 | #324 | Tragic 7.6% |
| Shoshone | 0.0 /100 | #325 | Tragic 7.6% |
| Immigrants | Dominican Republic | 0.0 /100 | #326 | Tragic 7.6% |
| Paiute | 0.0 /100 | #327 | Tragic 7.7% |
| Natives/Alaskans | 0.0 /100 | #328 | Tragic 7.7% |
| Immigrants | Yemen | 0.0 /100 | #329 | Tragic 7.8% |
| Yakama | 0.0 /100 | #330 | Tragic 7.9% |