Samoan vs Immigrants from Grenada 9th Grade
COMPARE
Samoan
Immigrants from Grenada
9th Grade
9th Grade Comparison
Samoans
Immigrants from Grenada
94.6%
9TH GRADE
17.3/ 100
METRIC RATING
206th/ 347
METRIC RANK
93.0%
9TH GRADE
0.0/ 100
METRIC RATING
299th/ 347
METRIC RANK
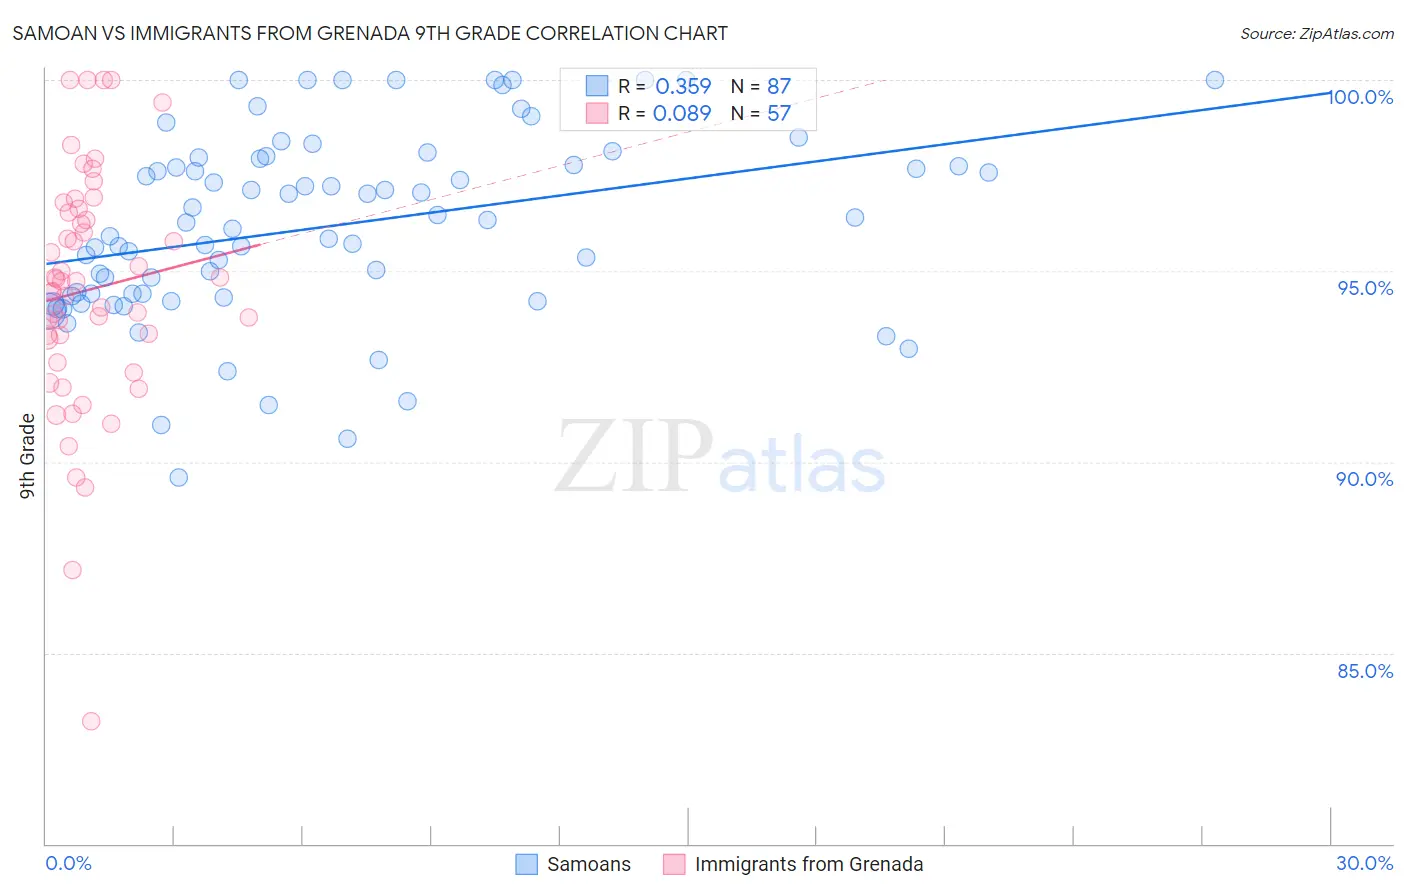
Samoan vs Immigrants from Grenada 9th Grade Correlation Chart
The statistical analysis conducted on geographies consisting of 225,201,909 people shows a mild positive correlation between the proportion of Samoans and percentage of population with at least 9th grade education in the United States with a correlation coefficient (R) of 0.359 and weighted average of 94.6%. Similarly, the statistical analysis conducted on geographies consisting of 67,193,627 people shows a slight positive correlation between the proportion of Immigrants from Grenada and percentage of population with at least 9th grade education in the United States with a correlation coefficient (R) of 0.089 and weighted average of 93.0%, a difference of 1.7%.
9th Grade Correlation Summary
| Measurement | Samoan | Immigrants from Grenada |
| Minimum | 89.6% | 83.2% |
| Maximum | 100.0% | 100.0% |
| Range | 10.4% | 16.8% |
| Mean | 96.2% | 94.5% |
| Median | 96.3% | 94.7% |
| Interquartile 25% (IQ1) | 94.3% | 92.9% |
| Interquartile 75% (IQ3) | 97.9% | 96.6% |
| Interquartile Range (IQR) | 3.6% | 3.7% |
| Standard Deviation (Sample) | 2.4% | 3.2% |
| Standard Deviation (Population) | 2.4% | 3.2% |
Similar Demographics by 9th Grade
Demographics Similar to Samoans by 9th Grade
In terms of 9th grade, the demographic groups most similar to Samoans are Immigrants from Sudan (94.6%, a difference of 0.0%), Immigrants from Morocco (94.6%, a difference of 0.010%), Immigrants from Pakistan (94.6%, a difference of 0.020%), Immigrants from Eastern Asia (94.6%, a difference of 0.030%), and Immigrants from Bahamas (94.6%, a difference of 0.030%).
| Demographics | Rating | Rank | 9th Grade |
| Laotians | 21.0 /100 | #199 | Fair 94.6% |
| Immigrants | Zaire | 20.6 /100 | #200 | Fair 94.6% |
| Blacks/African Americans | 20.5 /100 | #201 | Fair 94.6% |
| Immigrants | Eastern Asia | 19.8 /100 | #202 | Poor 94.6% |
| Immigrants | Bahamas | 19.8 /100 | #203 | Poor 94.6% |
| Moroccans | 19.6 /100 | #204 | Poor 94.6% |
| Immigrants | Sudan | 17.6 /100 | #205 | Poor 94.6% |
| Samoans | 17.3 /100 | #206 | Poor 94.6% |
| Immigrants | Morocco | 16.3 /100 | #207 | Poor 94.6% |
| Immigrants | Pakistan | 15.5 /100 | #208 | Poor 94.6% |
| Comanche | 14.9 /100 | #209 | Poor 94.6% |
| Immigrants | Chile | 13.4 /100 | #210 | Poor 94.5% |
| Immigrants | Indonesia | 12.3 /100 | #211 | Poor 94.5% |
| Immigrants | Malaysia | 12.2 /100 | #212 | Poor 94.5% |
| Immigrants | Oceania | 12.1 /100 | #213 | Poor 94.5% |
Demographics Similar to Immigrants from Grenada by 9th Grade
In terms of 9th grade, the demographic groups most similar to Immigrants from Grenada are Haitian (93.1%, a difference of 0.060%), Fijian (93.1%, a difference of 0.090%), Immigrants from Burma/Myanmar (93.1%, a difference of 0.12%), Indonesian (93.1%, a difference of 0.12%), and Yaqui (92.9%, a difference of 0.13%).
| Demographics | Rating | Rank | 9th Grade |
| Immigrants | Laos | 0.0 /100 | #292 | Tragic 93.2% |
| Sri Lankans | 0.0 /100 | #293 | Tragic 93.2% |
| Cubans | 0.0 /100 | #294 | Tragic 93.2% |
| Immigrants | Burma/Myanmar | 0.0 /100 | #295 | Tragic 93.1% |
| Indonesians | 0.0 /100 | #296 | Tragic 93.1% |
| Fijians | 0.0 /100 | #297 | Tragic 93.1% |
| Haitians | 0.0 /100 | #298 | Tragic 93.1% |
| Immigrants | Grenada | 0.0 /100 | #299 | Tragic 93.0% |
| Yaqui | 0.0 /100 | #300 | Tragic 92.9% |
| Immigrants | Haiti | 0.0 /100 | #301 | Tragic 92.7% |
| Immigrants | Dominica | 0.0 /100 | #302 | Tragic 92.7% |
| Guyanese | 0.0 /100 | #303 | Tragic 92.7% |
| Tohono O'odham | 0.0 /100 | #304 | Tragic 92.6% |
| Japanese | 0.0 /100 | #305 | Tragic 92.6% |
| Immigrants | Vietnam | 0.0 /100 | #306 | Tragic 92.6% |