Salvadoran vs West Indian Vision Disability
COMPARE
Salvadoran
West Indian
Vision Disability
Vision Disability Comparison
Salvadorans
West Indians
2.2%
VISION DISABILITY
27.4/ 100
METRIC RATING
189th/ 347
METRIC RANK
2.4%
VISION DISABILITY
0.2/ 100
METRIC RATING
257th/ 347
METRIC RANK
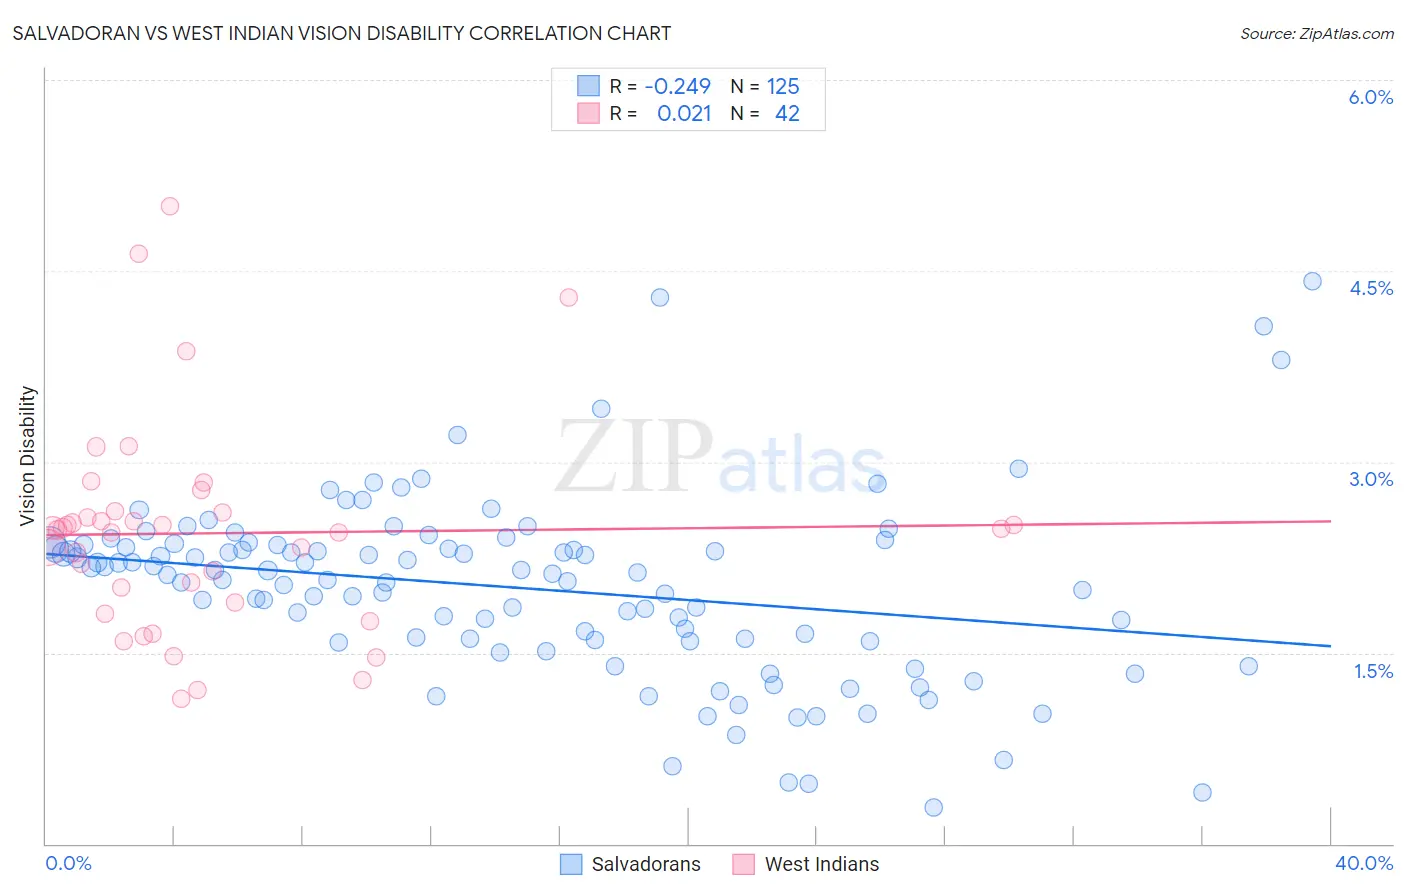
Salvadoran vs West Indian Vision Disability Correlation Chart
The statistical analysis conducted on geographies consisting of 398,695,149 people shows a weak negative correlation between the proportion of Salvadorans and percentage of population with vision disability in the United States with a correlation coefficient (R) of -0.249 and weighted average of 2.2%. Similarly, the statistical analysis conducted on geographies consisting of 253,927,950 people shows no correlation between the proportion of West Indians and percentage of population with vision disability in the United States with a correlation coefficient (R) of 0.021 and weighted average of 2.4%, a difference of 8.1%.
Vision Disability Correlation Summary
| Measurement | Salvadoran | West Indian |
| Minimum | 0.28% | 1.1% |
| Maximum | 4.4% | 5.0% |
| Range | 4.1% | 3.9% |
| Mean | 2.0% | 2.4% |
| Median | 2.1% | 2.5% |
| Interquartile 25% (IQ1) | 1.6% | 1.9% |
| Interquartile 75% (IQ3) | 2.3% | 2.6% |
| Interquartile Range (IQR) | 0.75% | 0.71% |
| Standard Deviation (Sample) | 0.72% | 0.83% |
| Standard Deviation (Population) | 0.71% | 0.82% |
Similar Demographics by Vision Disability
Demographics Similar to Salvadorans by Vision Disability
In terms of vision disability, the demographic groups most similar to Salvadorans are Guyanese (2.2%, a difference of 0.11%), Immigrants from Costa Rica (2.2%, a difference of 0.11%), Canadian (2.2%, a difference of 0.13%), European (2.2%, a difference of 0.13%), and British (2.2%, a difference of 0.19%).
| Demographics | Rating | Rank | Vision Disability |
| Costa Ricans | 40.7 /100 | #182 | Average 2.2% |
| Immigrants | Burma/Myanmar | 37.9 /100 | #183 | Fair 2.2% |
| Moroccans | 35.4 /100 | #184 | Fair 2.2% |
| Immigrants | Middle Africa | 33.5 /100 | #185 | Fair 2.2% |
| Native Hawaiians | 33.3 /100 | #186 | Fair 2.2% |
| Immigrants | St. Vincent and the Grenadines | 30.3 /100 | #187 | Fair 2.2% |
| Guyanese | 28.9 /100 | #188 | Fair 2.2% |
| Salvadorans | 27.4 /100 | #189 | Fair 2.2% |
| Immigrants | Costa Rica | 26.1 /100 | #190 | Fair 2.2% |
| Canadians | 25.8 /100 | #191 | Fair 2.2% |
| Europeans | 25.7 /100 | #192 | Fair 2.2% |
| British | 25.1 /100 | #193 | Fair 2.2% |
| Immigrants | Barbados | 24.0 /100 | #194 | Fair 2.2% |
| Immigrants | Immigrants | 23.7 /100 | #195 | Fair 2.2% |
| Immigrants | Grenada | 23.1 /100 | #196 | Fair 2.2% |
Demographics Similar to West Indians by Vision Disability
In terms of vision disability, the demographic groups most similar to West Indians are British West Indian (2.4%, a difference of 0.030%), White/Caucasian (2.4%, a difference of 0.040%), Immigrants from Haiti (2.4%, a difference of 0.080%), Belizean (2.4%, a difference of 0.21%), and Immigrants from Guatemala (2.4%, a difference of 0.40%).
| Demographics | Rating | Rank | Vision Disability |
| Bangladeshis | 0.5 /100 | #250 | Tragic 2.3% |
| Immigrants | Laos | 0.4 /100 | #251 | Tragic 2.4% |
| Immigrants | Micronesia | 0.3 /100 | #252 | Tragic 2.4% |
| Japanese | 0.3 /100 | #253 | Tragic 2.4% |
| Haitians | 0.3 /100 | #254 | Tragic 2.4% |
| Immigrants | Guatemala | 0.3 /100 | #255 | Tragic 2.4% |
| Immigrants | Haiti | 0.2 /100 | #256 | Tragic 2.4% |
| West Indians | 0.2 /100 | #257 | Tragic 2.4% |
| British West Indians | 0.2 /100 | #258 | Tragic 2.4% |
| Whites/Caucasians | 0.2 /100 | #259 | Tragic 2.4% |
| Belizeans | 0.2 /100 | #260 | Tragic 2.4% |
| Fijians | 0.1 /100 | #261 | Tragic 2.4% |
| Jamaicans | 0.1 /100 | #262 | Tragic 2.4% |
| Immigrants | Belize | 0.1 /100 | #263 | Tragic 2.4% |
| Immigrants | Liberia | 0.1 /100 | #264 | Tragic 2.4% |