Immigrants from Bolivia vs West Indian Vision Disability
COMPARE
Immigrants from Bolivia
West Indian
Vision Disability
Vision Disability Comparison
Immigrants from Bolivia
West Indians
1.8%
VISION DISABILITY
100.0/ 100
METRIC RATING
15th/ 347
METRIC RANK
2.4%
VISION DISABILITY
0.2/ 100
METRIC RATING
257th/ 347
METRIC RANK
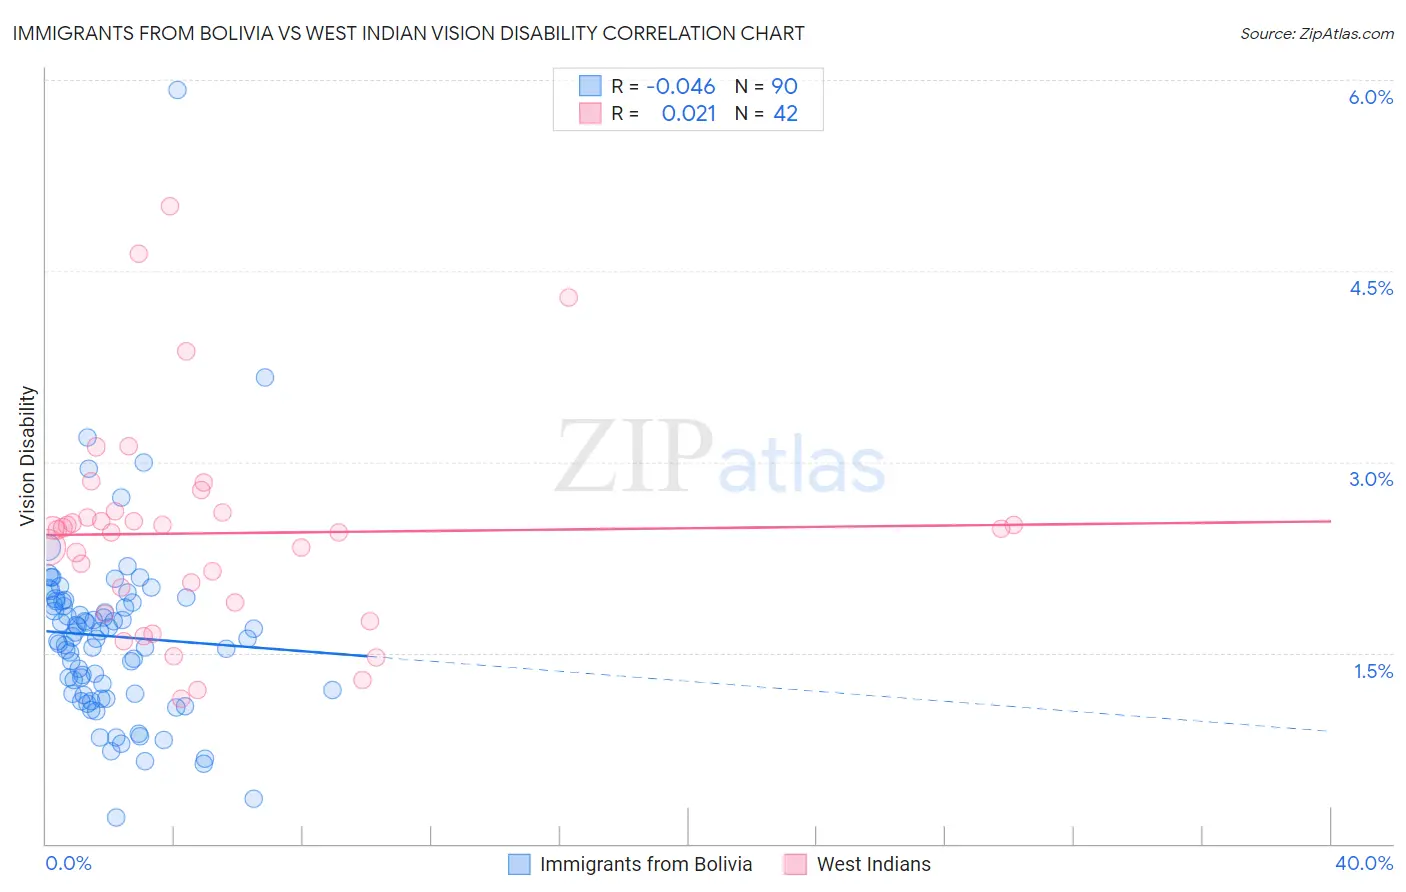
Immigrants from Bolivia vs West Indian Vision Disability Correlation Chart
The statistical analysis conducted on geographies consisting of 158,695,494 people shows no correlation between the proportion of Immigrants from Bolivia and percentage of population with vision disability in the United States with a correlation coefficient (R) of -0.046 and weighted average of 1.8%. Similarly, the statistical analysis conducted on geographies consisting of 253,927,950 people shows no correlation between the proportion of West Indians and percentage of population with vision disability in the United States with a correlation coefficient (R) of 0.021 and weighted average of 2.4%, a difference of 29.1%.
Vision Disability Correlation Summary
| Measurement | Immigrants from Bolivia | West Indian |
| Minimum | 0.21% | 1.1% |
| Maximum | 5.9% | 5.0% |
| Range | 5.7% | 3.9% |
| Mean | 1.6% | 2.4% |
| Median | 1.6% | 2.5% |
| Interquartile 25% (IQ1) | 1.2% | 1.9% |
| Interquartile 75% (IQ3) | 1.9% | 2.6% |
| Interquartile Range (IQR) | 0.72% | 0.71% |
| Standard Deviation (Sample) | 0.74% | 0.83% |
| Standard Deviation (Population) | 0.74% | 0.82% |
Similar Demographics by Vision Disability
Demographics Similar to Immigrants from Bolivia by Vision Disability
In terms of vision disability, the demographic groups most similar to Immigrants from Bolivia are Immigrants from China (1.8%, a difference of 0.42%), Indian (Asian) (1.8%, a difference of 0.44%), Burmese (1.8%, a difference of 0.45%), Immigrants from Eastern Asia (1.8%, a difference of 0.57%), and Immigrants from Korea (1.8%, a difference of 0.65%).
| Demographics | Rating | Rank | Vision Disability |
| Iranians | 100.0 /100 | #8 | Exceptional 1.8% |
| Immigrants | Singapore | 100.0 /100 | #9 | Exceptional 1.8% |
| Immigrants | Hong Kong | 100.0 /100 | #10 | Exceptional 1.8% |
| Immigrants | Israel | 100.0 /100 | #11 | Exceptional 1.8% |
| Immigrants | Korea | 100.0 /100 | #12 | Exceptional 1.8% |
| Immigrants | Eastern Asia | 100.0 /100 | #13 | Exceptional 1.8% |
| Immigrants | China | 100.0 /100 | #14 | Exceptional 1.8% |
| Immigrants | Bolivia | 100.0 /100 | #15 | Exceptional 1.8% |
| Indians (Asian) | 100.0 /100 | #16 | Exceptional 1.8% |
| Burmese | 100.0 /100 | #17 | Exceptional 1.8% |
| Bolivians | 100.0 /100 | #18 | Exceptional 1.9% |
| Immigrants | Sri Lanka | 100.0 /100 | #19 | Exceptional 1.9% |
| Asians | 100.0 /100 | #20 | Exceptional 1.9% |
| Turks | 100.0 /100 | #21 | Exceptional 1.9% |
| Immigrants | Pakistan | 100.0 /100 | #22 | Exceptional 1.9% |
Demographics Similar to West Indians by Vision Disability
In terms of vision disability, the demographic groups most similar to West Indians are British West Indian (2.4%, a difference of 0.030%), White/Caucasian (2.4%, a difference of 0.040%), Immigrants from Haiti (2.4%, a difference of 0.080%), Belizean (2.4%, a difference of 0.21%), and Immigrants from Guatemala (2.4%, a difference of 0.40%).
| Demographics | Rating | Rank | Vision Disability |
| Bangladeshis | 0.5 /100 | #250 | Tragic 2.3% |
| Immigrants | Laos | 0.4 /100 | #251 | Tragic 2.4% |
| Immigrants | Micronesia | 0.3 /100 | #252 | Tragic 2.4% |
| Japanese | 0.3 /100 | #253 | Tragic 2.4% |
| Haitians | 0.3 /100 | #254 | Tragic 2.4% |
| Immigrants | Guatemala | 0.3 /100 | #255 | Tragic 2.4% |
| Immigrants | Haiti | 0.2 /100 | #256 | Tragic 2.4% |
| West Indians | 0.2 /100 | #257 | Tragic 2.4% |
| British West Indians | 0.2 /100 | #258 | Tragic 2.4% |
| Whites/Caucasians | 0.2 /100 | #259 | Tragic 2.4% |
| Belizeans | 0.2 /100 | #260 | Tragic 2.4% |
| Fijians | 0.1 /100 | #261 | Tragic 2.4% |
| Jamaicans | 0.1 /100 | #262 | Tragic 2.4% |
| Immigrants | Belize | 0.1 /100 | #263 | Tragic 2.4% |
| Immigrants | Liberia | 0.1 /100 | #264 | Tragic 2.4% |