Salvadoran vs West Indian Householder Income Under 25 years
COMPARE
Salvadoran
West Indian
Householder Income Under 25 years
Householder Income Under 25 years Comparison
Salvadorans
West Indians
$55,412
HOUSEHOLDER INCOME UNDER 25 YEARS
100.0/ 100
METRIC RATING
56th/ 347
METRIC RANK
$51,583
HOUSEHOLDER INCOME UNDER 25 YEARS
18.5/ 100
METRIC RATING
192nd/ 347
METRIC RANK
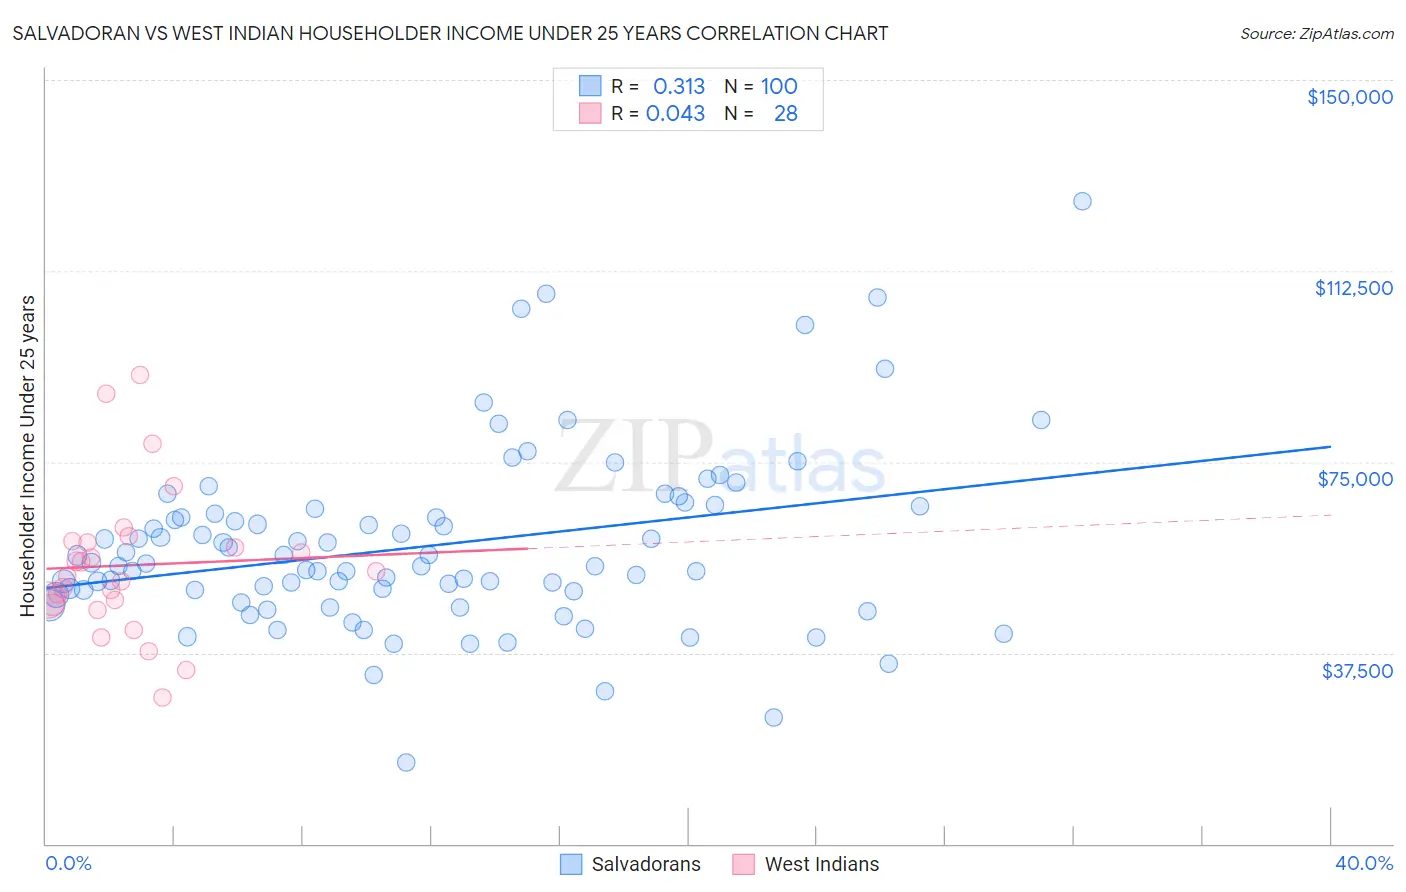
Salvadoran vs West Indian Householder Income Under 25 years Correlation Chart
The statistical analysis conducted on geographies consisting of 338,888,572 people shows a mild positive correlation between the proportion of Salvadorans and household income with householder under the age of 25 in the United States with a correlation coefficient (R) of 0.313 and weighted average of $55,412. Similarly, the statistical analysis conducted on geographies consisting of 221,989,526 people shows no correlation between the proportion of West Indians and household income with householder under the age of 25 in the United States with a correlation coefficient (R) of 0.043 and weighted average of $51,583, a difference of 7.4%.
Householder Income Under 25 years Correlation Summary
| Measurement | Salvadoran | West Indian |
| Minimum | $15,891 | $28,623 |
| Maximum | $126,250 | $92,155 |
| Range | $110,359 | $63,532 |
| Mean | $58,487 | $54,678 |
| Median | $54,772 | $53,085 |
| Interquartile 25% (IQ1) | $49,229 | $47,297 |
| Interquartile 75% (IQ3) | $65,284 | $59,304 |
| Interquartile Range (IQR) | $16,055 | $12,007 |
| Standard Deviation (Sample) | $17,623 | $14,375 |
| Standard Deviation (Population) | $17,535 | $14,116 |
Similar Demographics by Householder Income Under 25 years
Demographics Similar to Salvadorans by Householder Income Under 25 years
In terms of householder income under 25 years, the demographic groups most similar to Salvadorans are Immigrants from Ukraine ($55,447, a difference of 0.060%), Sri Lankan ($55,470, a difference of 0.10%), Immigrants from Poland ($55,474, a difference of 0.11%), Soviet Union ($55,340, a difference of 0.13%), and Immigrants from Romania ($55,522, a difference of 0.20%).
| Demographics | Rating | Rank | Householder Income Under 25 years |
| Iranians | 100.0 /100 | #49 | Exceptional $55,548 |
| Puget Sound Salish | 100.0 /100 | #50 | Exceptional $55,543 |
| Immigrants | Romania | 100.0 /100 | #51 | Exceptional $55,522 |
| Immigrants | Indonesia | 100.0 /100 | #52 | Exceptional $55,521 |
| Immigrants | Poland | 100.0 /100 | #53 | Exceptional $55,474 |
| Sri Lankans | 100.0 /100 | #54 | Exceptional $55,470 |
| Immigrants | Ukraine | 100.0 /100 | #55 | Exceptional $55,447 |
| Salvadorans | 100.0 /100 | #56 | Exceptional $55,412 |
| Soviet Union | 100.0 /100 | #57 | Exceptional $55,340 |
| Guyanese | 99.9 /100 | #58 | Exceptional $55,210 |
| Native Hawaiians | 99.9 /100 | #59 | Exceptional $55,158 |
| Immigrants | Lithuania | 99.9 /100 | #60 | Exceptional $55,028 |
| Immigrants | Europe | 99.9 /100 | #61 | Exceptional $55,022 |
| Immigrants | Uzbekistan | 99.8 /100 | #62 | Exceptional $54,846 |
| Immigrants | Belgium | 99.8 /100 | #63 | Exceptional $54,830 |
Demographics Similar to West Indians by Householder Income Under 25 years
In terms of householder income under 25 years, the demographic groups most similar to West Indians are Immigrants from Eritrea ($51,574, a difference of 0.020%), Malaysian ($51,615, a difference of 0.060%), Panamanian ($51,611, a difference of 0.060%), Guatemalan ($51,525, a difference of 0.11%), and Estonian ($51,523, a difference of 0.12%).
| Demographics | Rating | Rank | Householder Income Under 25 years |
| Immigrants | Latvia | 24.8 /100 | #185 | Fair $51,737 |
| Alaskan Athabascans | 23.8 /100 | #186 | Fair $51,713 |
| Immigrants | South Africa | 23.4 /100 | #187 | Fair $51,705 |
| Northern Europeans | 22.2 /100 | #188 | Fair $51,678 |
| Croatians | 21.6 /100 | #189 | Fair $51,662 |
| Malaysians | 19.7 /100 | #190 | Poor $51,615 |
| Panamanians | 19.5 /100 | #191 | Poor $51,611 |
| West Indians | 18.5 /100 | #192 | Poor $51,583 |
| Immigrants | Eritrea | 18.1 /100 | #193 | Poor $51,574 |
| Guatemalans | 16.4 /100 | #194 | Poor $51,525 |
| Estonians | 16.4 /100 | #195 | Poor $51,523 |
| Palestinians | 16.1 /100 | #196 | Poor $51,515 |
| Pima | 15.7 /100 | #197 | Poor $51,503 |
| Immigrants | Syria | 15.4 /100 | #198 | Poor $51,494 |
| Swiss | 15.4 /100 | #199 | Poor $51,493 |