Hawaiian vs West Indian Vision Disability
COMPARE
Hawaiian
West Indian
Vision Disability
Vision Disability Comparison
Hawaiians
West Indians
2.3%
VISION DISABILITY
2.9/ 100
METRIC RATING
227th/ 347
METRIC RANK
2.4%
VISION DISABILITY
0.2/ 100
METRIC RATING
257th/ 347
METRIC RANK
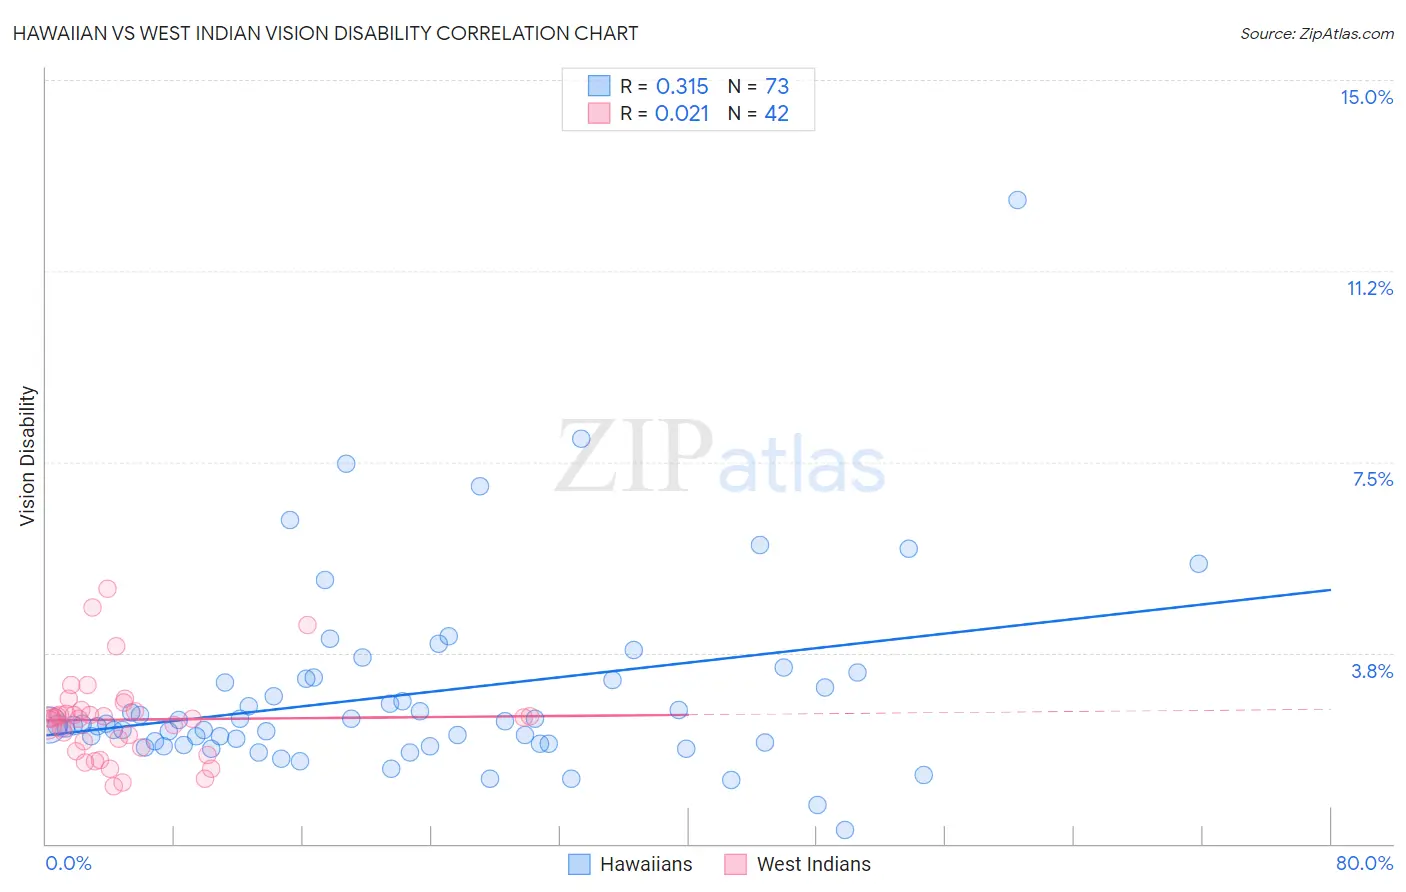
Hawaiian vs West Indian Vision Disability Correlation Chart
The statistical analysis conducted on geographies consisting of 327,342,922 people shows a mild positive correlation between the proportion of Hawaiians and percentage of population with vision disability in the United States with a correlation coefficient (R) of 0.315 and weighted average of 2.3%. Similarly, the statistical analysis conducted on geographies consisting of 253,927,950 people shows no correlation between the proportion of West Indians and percentage of population with vision disability in the United States with a correlation coefficient (R) of 0.021 and weighted average of 2.4%, a difference of 4.0%.
Vision Disability Correlation Summary
| Measurement | Hawaiian | West Indian |
| Minimum | 0.26% | 1.1% |
| Maximum | 12.7% | 5.0% |
| Range | 12.4% | 3.9% |
| Mean | 2.9% | 2.4% |
| Median | 2.3% | 2.5% |
| Interquartile 25% (IQ1) | 2.0% | 1.9% |
| Interquartile 75% (IQ3) | 3.2% | 2.6% |
| Interquartile Range (IQR) | 1.3% | 0.71% |
| Standard Deviation (Sample) | 1.9% | 0.83% |
| Standard Deviation (Population) | 1.9% | 0.82% |
Similar Demographics by Vision Disability
Demographics Similar to Hawaiians by Vision Disability
In terms of vision disability, the demographic groups most similar to Hawaiians are Immigrants from Germany (2.3%, a difference of 0.050%), Hmong (2.3%, a difference of 0.24%), Immigrants from Western Africa (2.3%, a difference of 0.27%), Irish (2.3%, a difference of 0.28%), and Basque (2.3%, a difference of 0.31%).
| Demographics | Rating | Rank | Vision Disability |
| Guamanians/Chamorros | 3.9 /100 | #220 | Tragic 2.3% |
| French Canadians | 3.9 /100 | #221 | Tragic 2.3% |
| Immigrants | Senegal | 3.8 /100 | #222 | Tragic 2.3% |
| Basques | 3.5 /100 | #223 | Tragic 2.3% |
| Irish | 3.4 /100 | #224 | Tragic 2.3% |
| Immigrants | Western Africa | 3.4 /100 | #225 | Tragic 2.3% |
| Immigrants | Germany | 3.0 /100 | #226 | Tragic 2.3% |
| Hawaiians | 2.9 /100 | #227 | Tragic 2.3% |
| Hmong | 2.5 /100 | #228 | Tragic 2.3% |
| Welsh | 2.3 /100 | #229 | Tragic 2.3% |
| Nicaraguans | 2.2 /100 | #230 | Tragic 2.3% |
| Immigrants | Ecuador | 2.0 /100 | #231 | Tragic 2.3% |
| German Russians | 1.8 /100 | #232 | Tragic 2.3% |
| Central Americans | 1.8 /100 | #233 | Tragic 2.3% |
| Scottish | 1.6 /100 | #234 | Tragic 2.3% |
Demographics Similar to West Indians by Vision Disability
In terms of vision disability, the demographic groups most similar to West Indians are British West Indian (2.4%, a difference of 0.030%), White/Caucasian (2.4%, a difference of 0.040%), Immigrants from Haiti (2.4%, a difference of 0.080%), Belizean (2.4%, a difference of 0.21%), and Immigrants from Guatemala (2.4%, a difference of 0.40%).
| Demographics | Rating | Rank | Vision Disability |
| Bangladeshis | 0.5 /100 | #250 | Tragic 2.3% |
| Immigrants | Laos | 0.4 /100 | #251 | Tragic 2.4% |
| Immigrants | Micronesia | 0.3 /100 | #252 | Tragic 2.4% |
| Japanese | 0.3 /100 | #253 | Tragic 2.4% |
| Haitians | 0.3 /100 | #254 | Tragic 2.4% |
| Immigrants | Guatemala | 0.3 /100 | #255 | Tragic 2.4% |
| Immigrants | Haiti | 0.2 /100 | #256 | Tragic 2.4% |
| West Indians | 0.2 /100 | #257 | Tragic 2.4% |
| British West Indians | 0.2 /100 | #258 | Tragic 2.4% |
| Whites/Caucasians | 0.2 /100 | #259 | Tragic 2.4% |
| Belizeans | 0.2 /100 | #260 | Tragic 2.4% |
| Fijians | 0.1 /100 | #261 | Tragic 2.4% |
| Jamaicans | 0.1 /100 | #262 | Tragic 2.4% |
| Immigrants | Belize | 0.1 /100 | #263 | Tragic 2.4% |
| Immigrants | Liberia | 0.1 /100 | #264 | Tragic 2.4% |